
Learn LiDAR
Digital Elevation Model (DEM): Complete LiDAR Guide
From LiDAR Point Clouds to Terrain Analysis
No credit card required • 50 hectares included
A Digital Elevation Model (DEM) is a 3D representation of terrain surface elevation. This guide explains what DEMs are, how they differ from DTM and DSM, and how LiDAR technology creates accurate elevation models for topographic analysis, flood modeling, and GIS applications.
What is a Digital Elevation Model?
A Digital Elevation Model is a raster grid where each cell contains an elevation value. According to the USGS definition, a DEM represents “the bare ground (bare earth) topographic surface of the Earth excluding trees, buildings, and any other surface objects.”
DEM Data Sources
DEMs are created from various data sources:
- LiDAR point clouds — most accurate for local/regional mapping
- Photogrammetry and stereo imagery
- Radar data (InSAR, IfSAR)
- Topographic surveys
- Contour line interpolation
Why LiDAR is Best
LiDAR-derived DEMs offer the highest accuracy because LiDAR pulses can penetrate vegetation canopy and measure the actual ground surface underneath.
This capability is critical for forested areas where other technologies only capture the top of the tree canopy, not the terrain beneath.
DEM vs DTM vs DSM: Understanding the Terminology
The terms DEM, DTM, and DSM are often used interchangeably, causing confusion. Here’s how they relate
| Term | Full Name | What It Represents |
|---|---|---|
| DEM | Digital Elevation Model | Umbrella term for any elevation model (often means bare earth) |
| DTM | Digital Terrain Model | Bare earth surface only (no objects) |
| DSM | Digital Surface Model | Top of all objects (buildings, trees, etc.) |
Key insight: In the United States, DEM and DTM are used synonymously to mean bare-earth elevation. In some European contexts, DEM is used as a broader umbrella term that includes both DTM and DSM.
For detailed comparisons, see our guides on Digital Terrain Models (DTM) and Digital Surface Models (DSM).
Digital Surface Model (DSM)
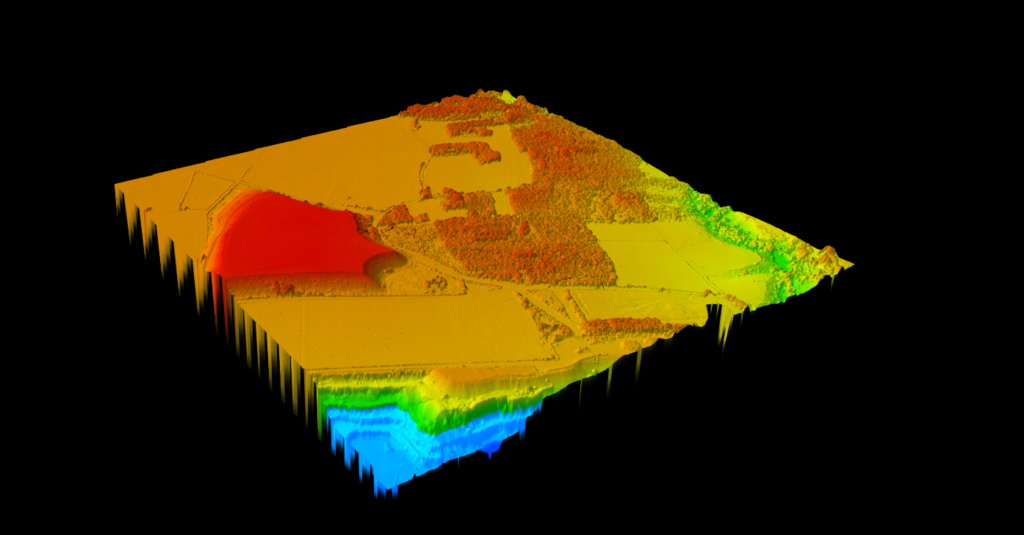
Capture everything above ground level
The DSM preserves the highest elevation at each point, including buildings, trees, and infrastructure. Color gradients visualize surface heights, making it easy to identify structures and canopy patterns across your survey area.
- Preserves all above-ground features for complete surface mapping
- Color gradient visualization highlights elevation differences
- Ideal for urban planning, obstruction analysis, and visibility studies
BARE EARTH EXTRACTION
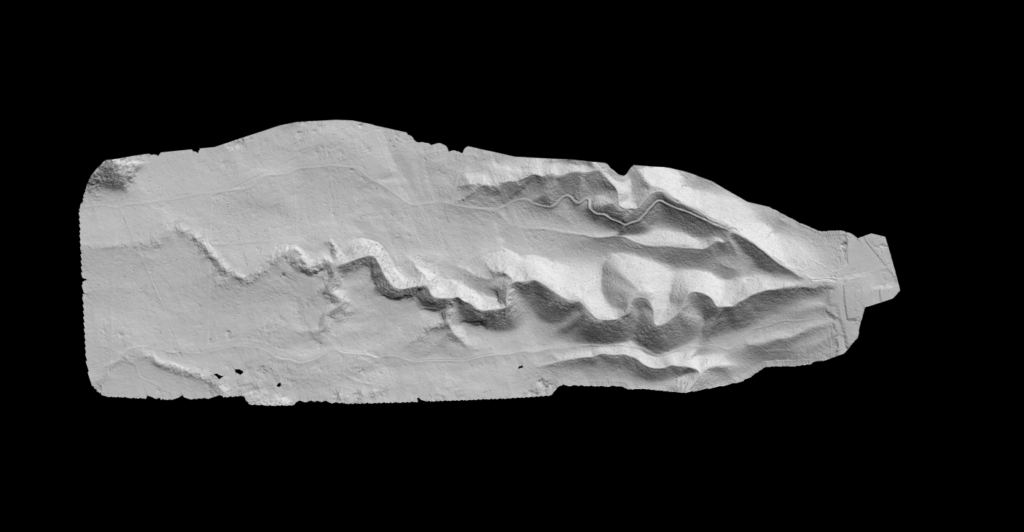
Digital Terrain Model (DTM)
See the ground beneath the clutter
The DTM automatically isolates ground points from vegetation, buildings, and noise to generate a clean bare-earth surface. Hillshade colorization provides instant terrain visualization, ready for engineering analysis or topographic mapping.
- Automatic ground classification removes above-ground features
- Hillshade visualization reveals terrain relief at a glance
- Export as GeoTIFF at your chosen resolution for GIS or CAD
How LiDAR Creates DEMs
Creating a DEM from LiDAR involves several processing steps that transform raw point measurements into a continuous elevation surface.
Point Cloud Classification
Raw LiDAR captures everything: ground, vegetation, buildings, vehicles. Ground classification algorithms identify which points represent the actual terrain surface.
Ground Point Interpolation
Once ground points are classified, they’re interpolated using TIN, IDW, natural neighbor, or kriging methods into a continuous surface.
Raster Generation
The interpolated surface is sampled onto a regular grid. Typical LiDAR DEMs range from 0.5m to 2m cell size depending on point density.
DEM Quality and Accuracy
DEM accuracy depends on several key factors
Source Data Quality
LiDAR point density and measurement accuracy directly impact the final DEM quality.
Classification Accuracy
How well ground points are identified and separated from vegetation and structures.
Terrain Type
Flat terrain is easier to model accurately than steep slopes or complex topography.
Vegetation Density
Dense canopy reduces ground point detection, requiring more sophisticated classification.
Applications of Digital Elevation Models
DEMs are fundamental to many geospatial workflows across multiple industries
Hydrology & Flood Modeling
DEMs enable watershed delineation, flow direction analysis, and flood inundation modeling. Water flows downhill, so accurate elevation data is critical for predicting drainage patterns and flood risk.
Slope & Terrain Analysis
From DEMs, you can derive slope maps, aspect maps, and hillshade visualizations. These support site planning, erosion assessment, and terrain visualization. See our slope map guide and hillshade guide.
Contour Line Generation
DEMs serve as the source for generating accurate contour lines used in topographic maps and engineering drawings. Learn about contour line generation from LiDAR.
Volume Calculations
By comparing two DEMs (before and after), you can calculate stockpile volumes, cut/fill quantities, and terrain changes over time.
Creating DEMs with Lidarvisor
Lidarvisor automates DEM creation from LiDAR point clouds. No manual classification or complex software setup required
1. Upload
Upload your point cloud in LAS or LAZ format
2. Classify
AI identifies ground, vegetation, buildings
3. Generate
Creates bare-earth DTM from ground points
4. Export
Download as GeoTIFF or other formats
DEM File Formats
DEMs are typically stored in these formats:
- GeoTIFF — Most common raster format, includes georeferencing
- ASCII Grid — Text-based format, widely compatible
- Esri Grid — Native ArcGIS format
- USGS DEM — Legacy format from USGS surveys
Lidarvisor exports DEMs in GeoTIFF format with embedded coordinate reference system information.
Common DEM Challenges
Vegetation Filtering
Dense canopy can prevent laser pulses from reaching ground. Modern AI-based classification handles these challenges better than traditional algorithms, achieving more accurate ground extraction in difficult terrain.
Water Surfaces
Standard LiDAR doesn’t penetrate water. Special bathymetric sensors using green wavelength lasers are needed for underwater terrain mapping.
Urban Areas
Complex geometry with buildings, bridges, and infrastructure requires careful ground classification to avoid misclassifying elevated structures as terrain.
Data Voids
Areas with no ground returns due to dense vegetation or water need interpolation from surrounding points, which can reduce local accuracy.
Summary
Digital Elevation Models are essential products derived from LiDAR data. Whether you call it a DEM or DTM, the bare-earth elevation surface enables terrain analysis, flood modeling, and countless other applications.
With automated tools like Lidarvisor, creating accurate DEMs from LiDAR point clouds no longer requires specialized expertise or expensive desktop software.
Related Guides: DTM Guide • DSM Guide • Classification Guide • Hillshade Guide • Slope Map Guide
Related Articles
Terrain & Elevation
• DTM Guide • DSM Guide • DTM vs DSM • Hillshade Maps • What is Hillshade?
Point Cloud Classification
• Classification Guide • Classification Codes • Classification Methods • What is Classification? • Classification Software
Ready to Create Your DEM?
Create a FREE account now and start processing your point cloud. Get 5 GB of storage space and classify up to 50 hectares for free. Lidarvisor’s AI-powered classification automatically extracts ground points and generates accurate DEMs.
Create free account50 hectares free. No credit card. No software to install.