
Learn LiDAR
What is a Slope Map?
Terrain Steepness Visualization from LiDAR
No credit card required • 50 hectares included
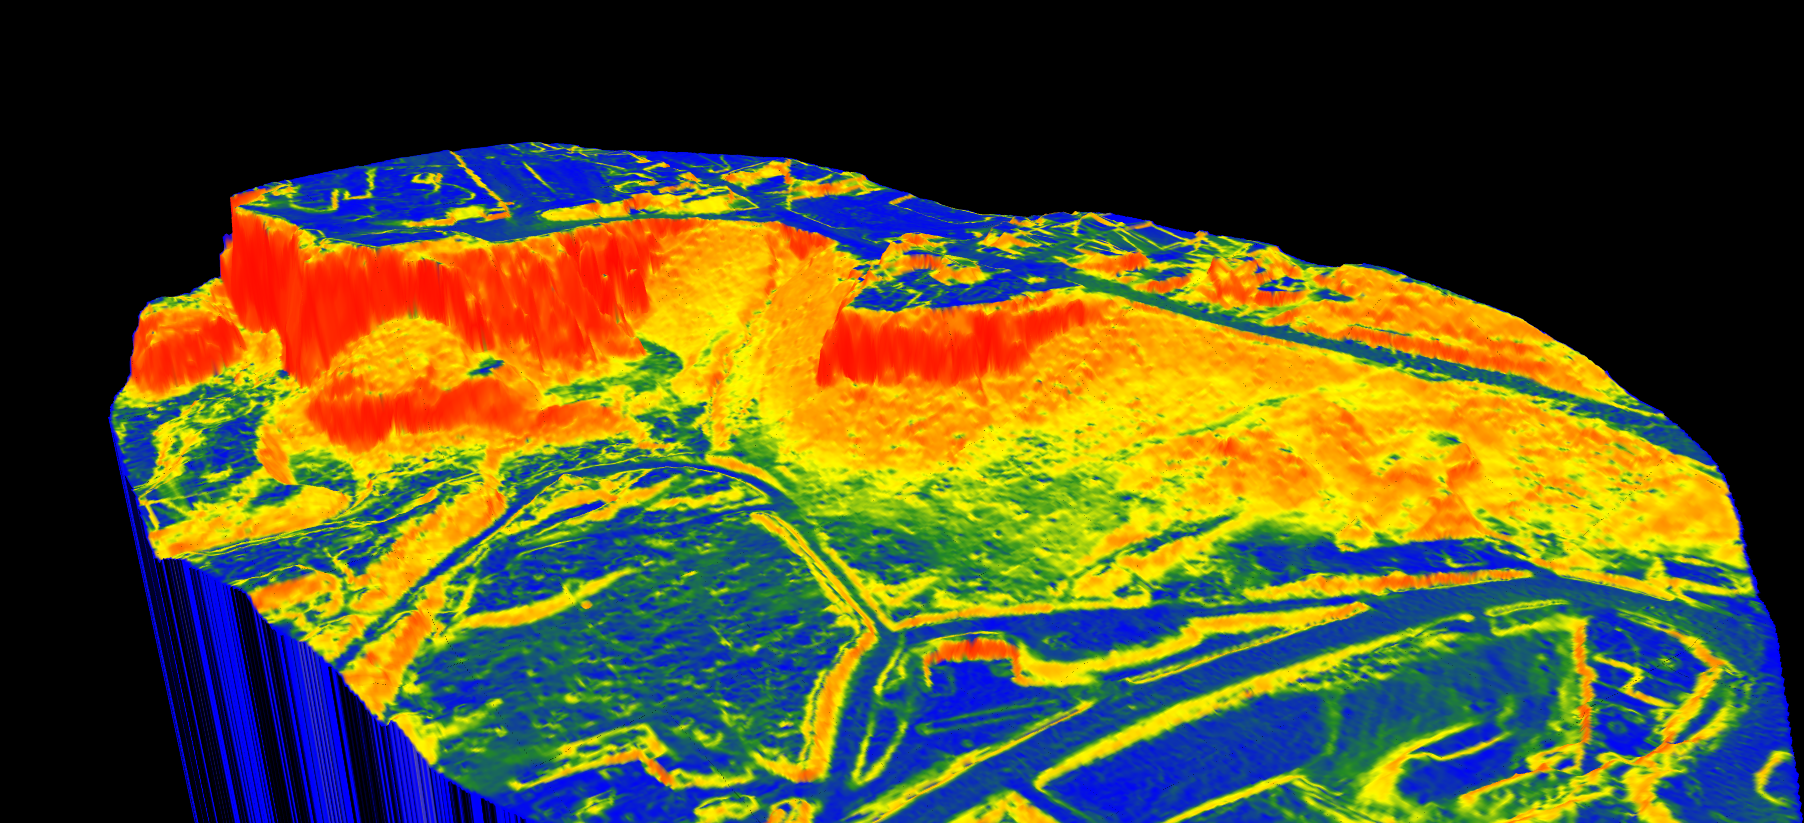
A slope map transforms complex topographic information into an easy-to-read color-coded visualization where each color represents a different degree of steepness. Generated from elevation data, it shows how steep the terrain is across any surveyed area.
How Does It Work?
Slope maps are created by analyzing Digital Terrain Models (DTM), precise 3D representations of the ground surface. The system calculates the rate of change in elevation between neighboring points and expresses this as either:
- Degrees (0° = flat, 90° = vertical cliff)
- Percentage (0% = flat, 100% = 45° angle)
The result is typically displayed using a gradient color scale: green for flat areas, yellow for moderate slopes, and red or purple for steep terrain.
Why Are Slope Maps Useful?
Slope maps are invaluable across many industries, providing critical terrain information for planning and analysis
Construction & Civil Engineering
Identify suitable building sites, plan drainage systems and road alignments, and calculate earthwork volumes with precise terrain data.
Forestry & Environmental
Assess erosion risk in sensitive areas, plan sustainable harvesting routes, and evaluate land stability for reforestation projects.
Power Line & Infrastructure
Determine optimal tower placement, plan safe access routes for maintenance, and identify potential landslide risks near infrastructure.
How LidarVisor Generates Slope Maps
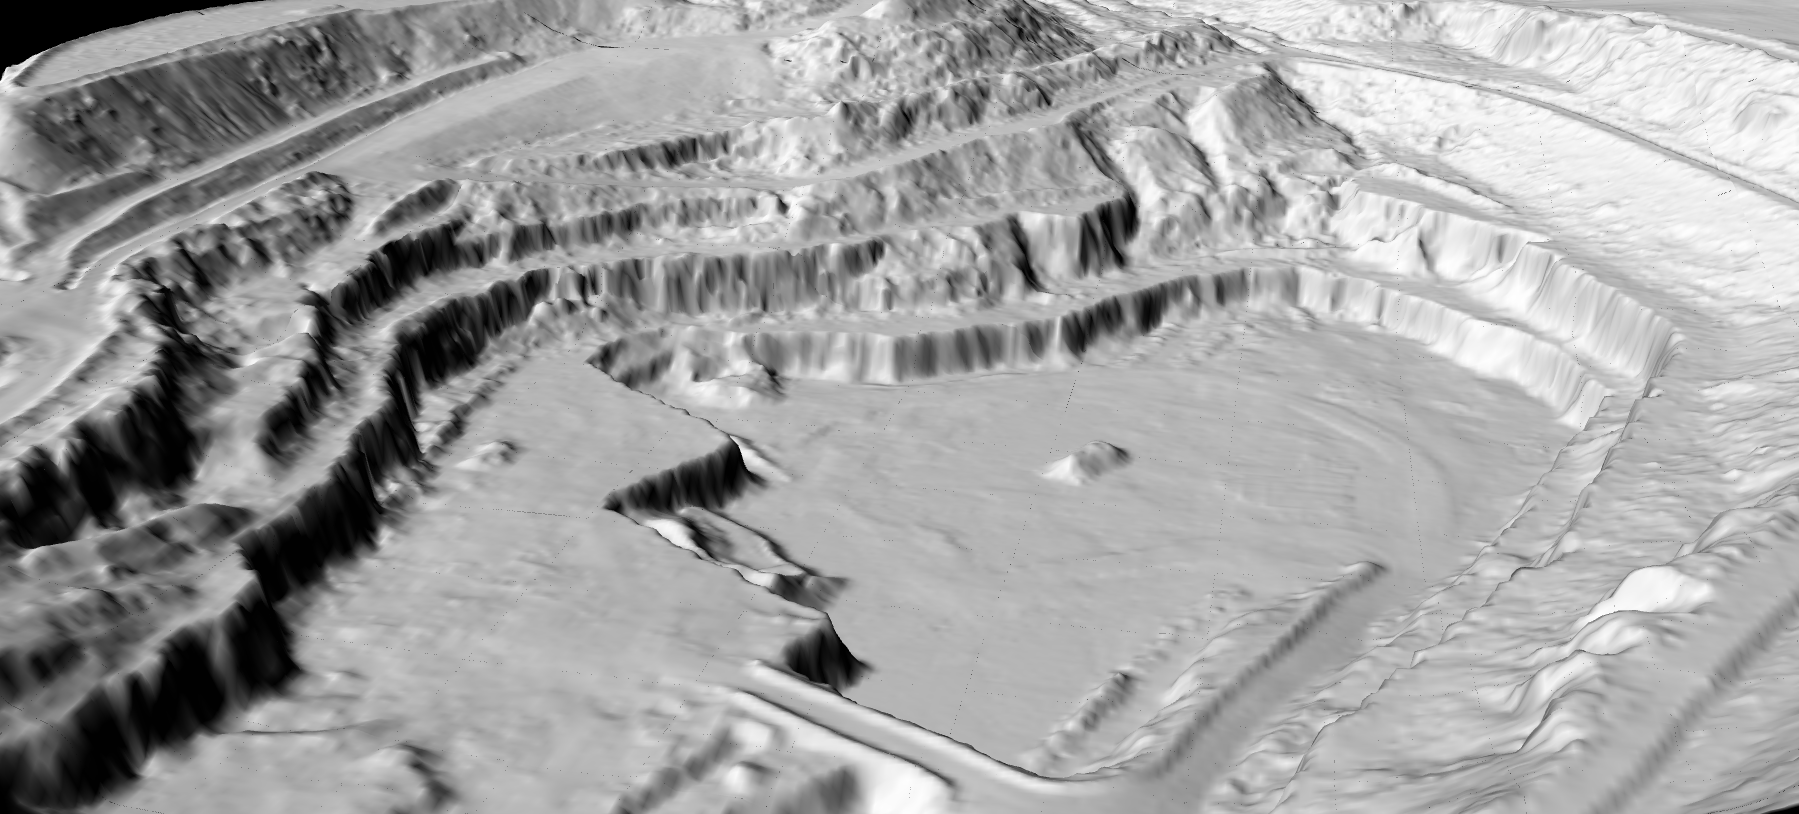
LidarVisor creates slope maps from LiDAR point cloud data with precision. The platform first classifies ground points to build an accurate DTM, then automatically calculates slope values across the entire surveyed area.
The result is an interactive layer you can overlay on your 3D visualization, helping you quickly identify terrain challenges and make informed decisions, all without needing specialized GIS software.
Key Benefits
- Instant terrain assessment: Visualize slope conditions across entire survey areas in seconds
- Risk identification: Quickly spot areas prone to erosion, landslides, or drainage issues
- Planning optimization: Make informed decisions about construction sites, road alignments, and infrastructure placement
- Multi-industry value: Applicable to construction, forestry, environmental management, and utility corridors
Related Articles
Terrain & Elevation
• DTM Guide • DSM Guide • DEM Guide • DTM vs DSM • Hillshade Maps
Point Cloud Classification
• Classification Guide • Classification Codes • Classification Methods • What is Classification? • Classification Software
Ready to Analyze Terrain Slope?
Upload your LiDAR data and generate slope maps automatically. Start with 50 Hectares of free processing.
Create free account50 hectares free. No credit card. No software to install.