
01
Upload
Drag and drop LAS or LAZ files from drone, helicopter or fixed-wing surveys.
Features
Point Cloud Viewer Point Cloud Preprocessing Point Cloud Classification Point Cloud Rasterization Point Cloud Vectorization Processing APIIndustry
Land Surveying Utility Vegetation Management Forestry Hydrology & WaterMore
Pricing ContactPowerline corridors
LiDAR-based vegetation management that identifies encroachment risks, measures clearances, and delivers actionable coordinates for your field crews. Process corridor scans in minutes, not weeks.
No software to install • No parameters to configure
The challenge
Corridor LiDAR captures precise 3D data, but processing hundreds of miles has meant specialist software and weeks of manual work.
What it does
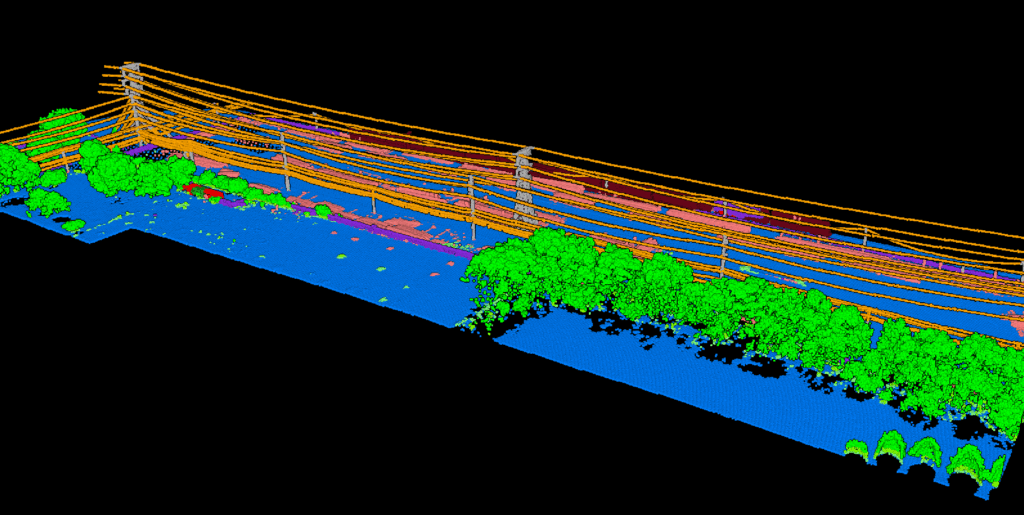
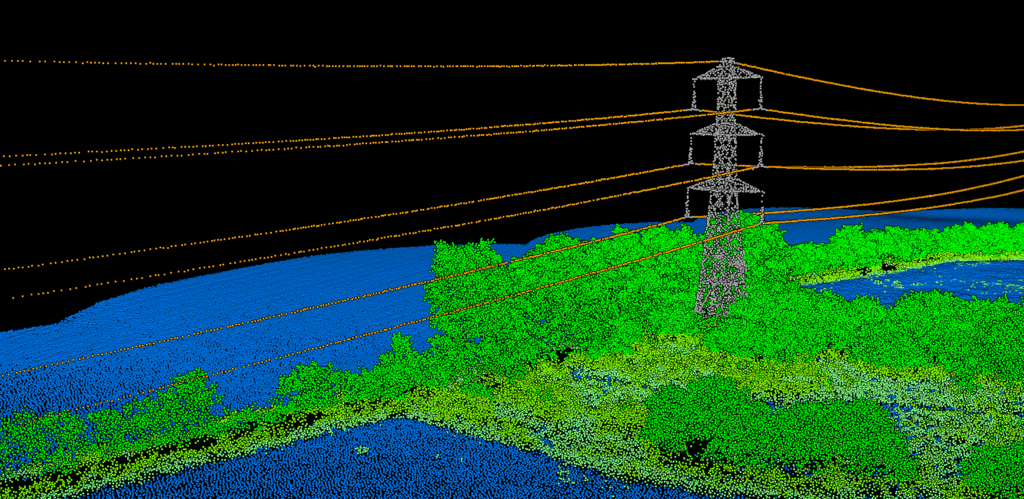
Infrastructure detection
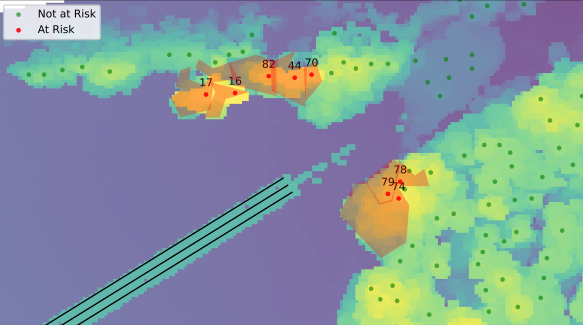
Automatic extraction of power line infrastructure.
Wires, poles, towers and other transmission structures are identified and separated from surrounding vegetation and terrain. No manual classification.
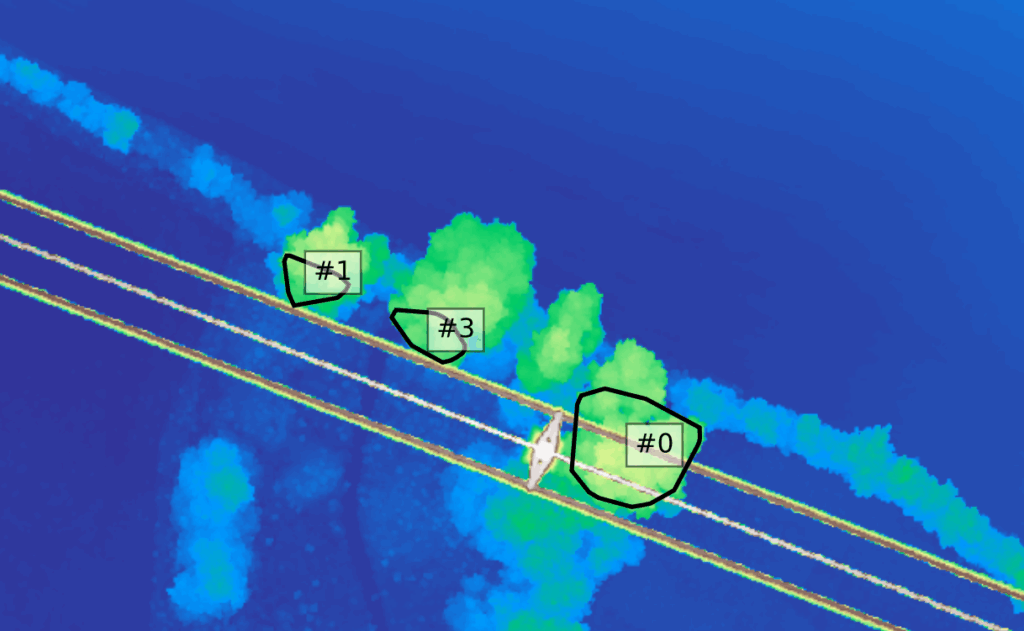
Threat detection
Find vegetation violating your clearance zones.
Lidarvisor analyses the relationship between vegetation points and the detected infrastructure, flagging where growth is approaching or already violating your clearance requirements.
Risk assessment
Find danger trees before the next storm.
Not every threat is encroachment. A 60-foot tree standing 50 feet from the line is a fall-in risk waiting for weather. Lidarvisor identifies trees tall enough to strike infrastructure if they fall, even when they sit outside the clearance zone today.
Field ready
Navigate crews directly to every hazard.
Every identified threat comes with coordinates your crews can navigate to. No vague descriptions, no hand-drawn maps — field crews drive straight to each hazard.
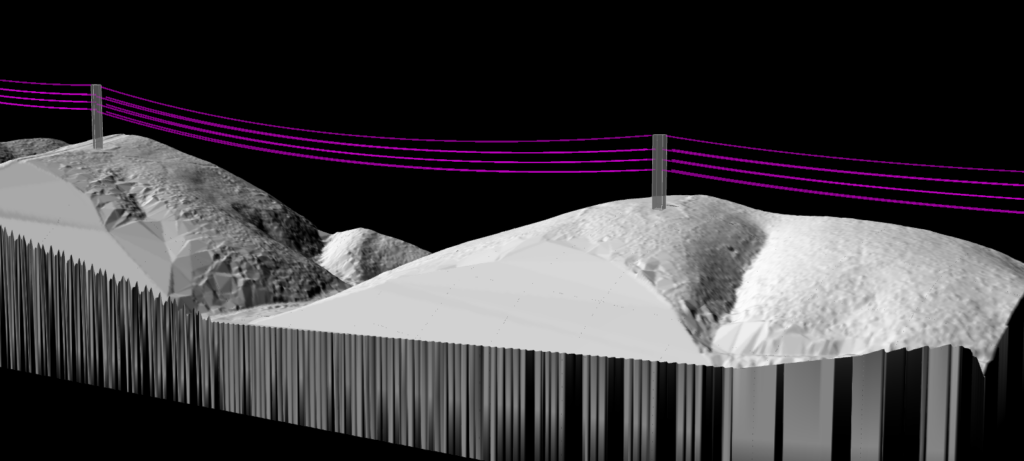
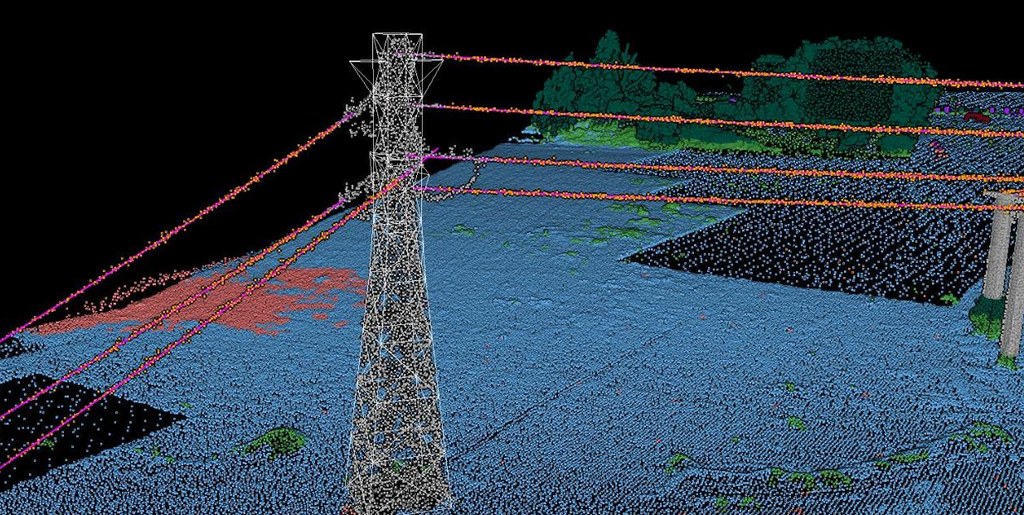
Power line vectorization
Every span and every support, measured.
Every conductor comes out as a 3D line that knows the two towers it hangs between, with its span length, its sag and its clearance to the ground and to vegetation, as surveyed on the day of the flight. Every support carries its type, its height and its lean. The whole inventory reads in a Towers panel under the viewer, so you do not have to download a file to see which tower is leaning.
Real project, real output
Demo 2 is a DJI drone survey of 17.6 hectares in France, crossed by overhead lines. It opens in every Lidarvisor account, so you can switch each finding on and off over the line yourself.
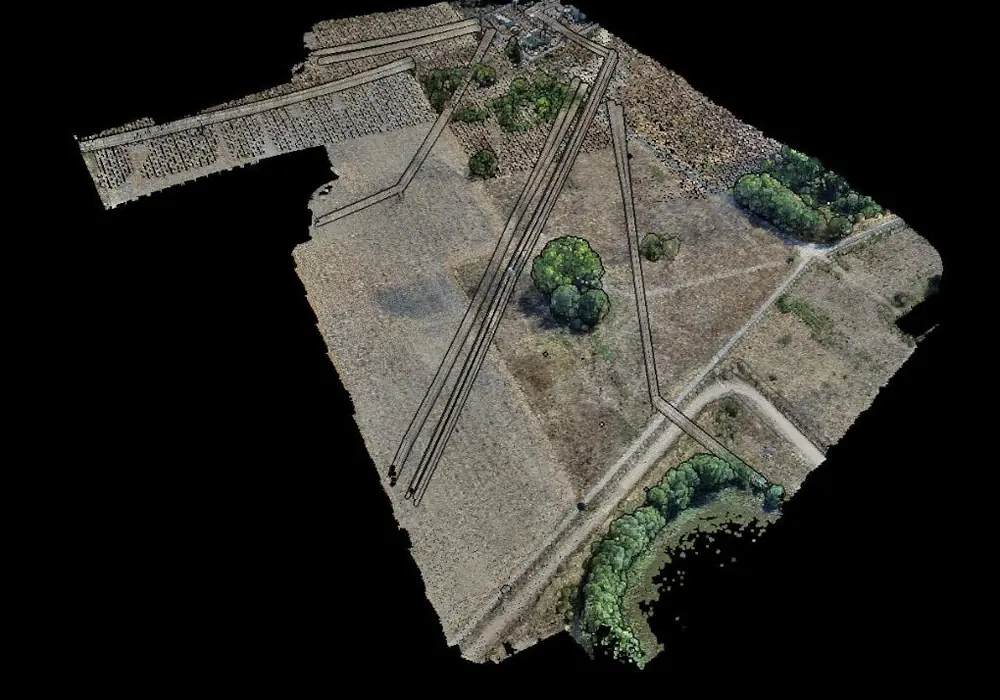
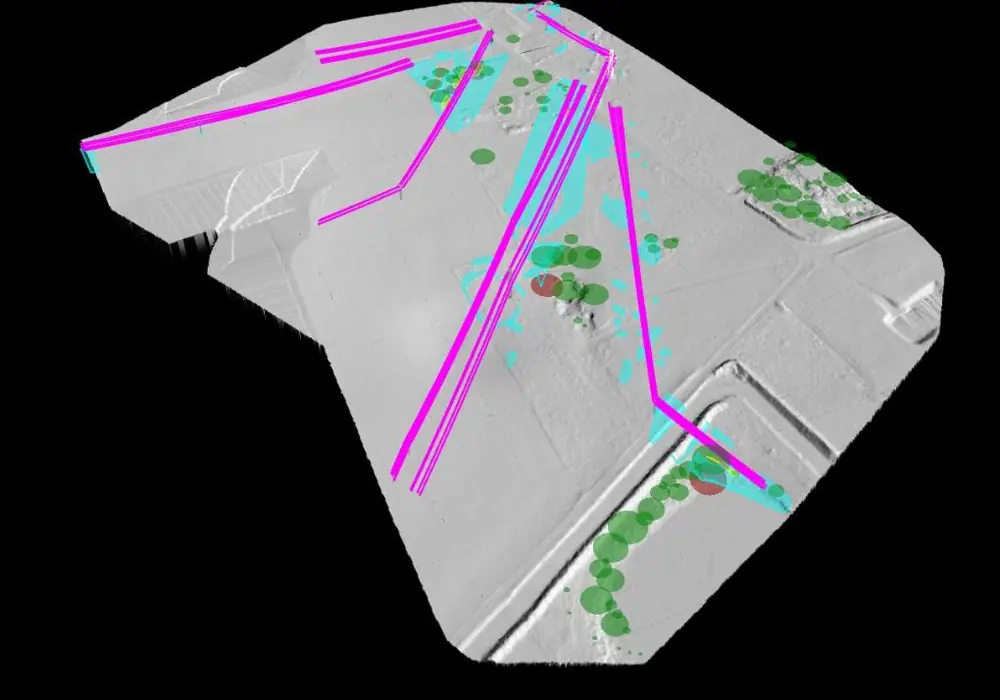
Both views come from the Lidarvisor viewer, from the same camera position, on 12 October 2026.
Settings of this run: buffers at 1, 2 and 5 m around the wires, a 5 m clearance below them, 15 m of right of way on each side. Findings: 13 in the buffers, 7 under the clearance, 82 in the right of way, and 5 of the 107 trees measured are tall enough to reach a conductor if they fell. The run time covers every layer this project holds, terrain and contours included.
Deliverables
Each of these is a separate layer you can switch on, delivered alongside the classified cloud.
| Layer | What it is | Formats |
|---|---|---|
| Conductors | Wire centrelines in 3D, with span, length, sag and clearance | GeoJSON · SHP · DXF |
| Towers & poles | Support positions with type, height and lean, plus 3D structures | GeoJSON · SHP · DXF |
| Clearance zone | Vegetation found inside the clearance distance you set | CSV · GeoJSON · SHP · DXF |
| Buffer zones | Vegetation found in each of the distance bands you set | CSV · GeoJSON · SHP · DXF |
| Right of way zone | Vegetation found in the maintained corridor | CSV · GeoJSON · SHP · DXF |
| Fallen tree risk | Crowns of the trees tall enough to reach the line if they fall | CSV · GeoJSON · SHP · DXF |
| Risk report | Threat location, zone and distance, with a corridor summary by span | PDF · CSV |
The conductor, support, finding and report formats listed here are the files the Demo 2 project above holds today. Demo projects download on every plan, the free one included.
How it works
Process corridor data from any platform — drone, helicopter or fixed-wing.
Drag and drop LAS or LAZ files from drone, helicopter or fixed-wing surveys.
The AI classifies ground, vegetation and power line infrastructure automatically.
Review encroachment zones and fall-in risks in the browser viewer, with clearance measurements.
Download risk reports with GPS coordinates and send crews to the high-priority threats.
Applications
Analyse hundreds of miles of high-voltage line, identifying threats along the whole route.
Process urban and rural distribution surveys, prioritising work orders by severity.
Rapidly process new captures after major storms to find vegetation damage and impacts.
Clearance measurements and reports with coordinates, ready for your compliance files.
Questions
Corridor LiDAR in LAS or LAZ format from any platform — drone, helicopter or fixed-wing. The AI handles point clouds from any sensor and classifies ground, vegetation and power line infrastructure without manual parameter tuning.
After classification, Lidarvisor analyses the spatial relationship between vegetation points and the detected infrastructure. You define the required clearance buffers, and the system flags all vegetation inside those zones. The zone a finding falls in tells you how close it is to the conductors, and each finding records its distance to the wire, its span and its nearest tower.
Encroachment means vegetation is already growing into the clearance zone around your conductors. Fall-in risk identifies trees currently outside that zone but tall enough to strike infrastructure if they fall. Both matter for a complete vegetation management programme.
Classified point clouds in LAS, risk reports in CSV or PDF with GPS coordinates, and power line, tower and finding layers in GeoJSON, SHP or DXF. Reports carry threat location, the zone it falls in and its distance to the wire, with field-ready coordinates for crew navigation. The vegetation report adds a corridor summary by span, and the project report lists leaning towers against your own bands.
It depends on the area and the point density. Demo 2, a 17.6 ha corridor, took 54 minutes for every layer, terrain and contours included. Larger projects take longer, and you get an email when processing completes.
Documentation
How to run vegetation management analysis with Lidarvisor.
Your LiDAR data already contains the answers. Lidarvisor extracts the threats, measures the clearances, and delivers coordinates your crews can use today.
Start freeNo software to install. No parameters to configure. View pricing or contact our team