
Tutorials,Learn LiDAR
Hillshade Map: Creating Stunning Terrain Visualizations
A hillshade map is a grayscale representation of terrain that simulates how sunlight and shadows would fall across a landscape, revealing three-dimensional character on a flat map.
No credit card required • 50 hectares included
How Hillshading Works
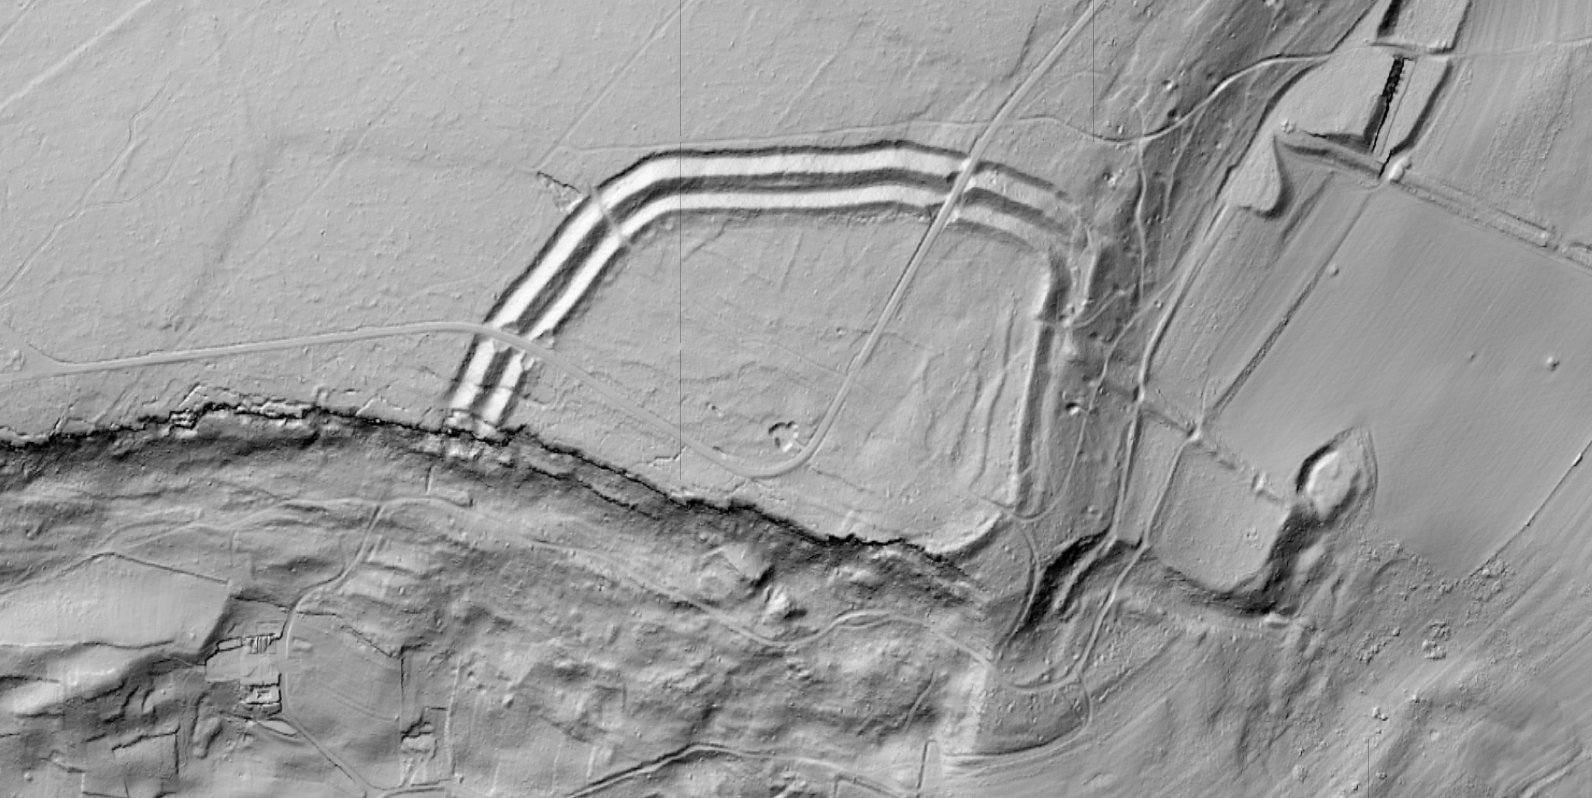
Unlike elevation maps showing height through color gradients, hillshade maps use light and shadow to create an intuitive sense of topography.
Ridges appear bright on the sun-facing side and dark in shadow. Valleys show the reverse pattern. The result is a realistic, easily understood terrain visualization.
Hillshade maps are created from Digital Elevation Models (DEMs), calculating how much light each cell would receive based on slope, aspect, and light source position.
The Illumination Model
1. Calculate Slope & Aspect
For each DEM cell, determine steepness (slope) and compass direction (aspect).
2. Compare to Light Source
How directly does light hit this surface? Facing toward or away from light?
3. Assign Brightness
Perpendicular to light = bright (255), parallel = medium (128), facing away = dark (0).
Key Parameters
Azimuth (Sun Direction)
Compass direction of light source in degrees clockwise from north:
- 0° — North, shadows fall south
- 90° — East, shadows fall west
- 180° — South, shadows fall north
- 315° — Northwest (standard convention)
Why 315°? Creates intuitive shading — terrain “pops” correctly.
Altitude (Sun Elevation)
Angle of light source above horizon in degrees:
- 0° — Sun at horizon, extreme shadows
- 30° — Low sun, dramatic relief
- 45° — Standard default setting
- 60° — High sun, subtle shadows
- 90° — Directly overhead, no shadows
Hillshade in Mountainous Terrain
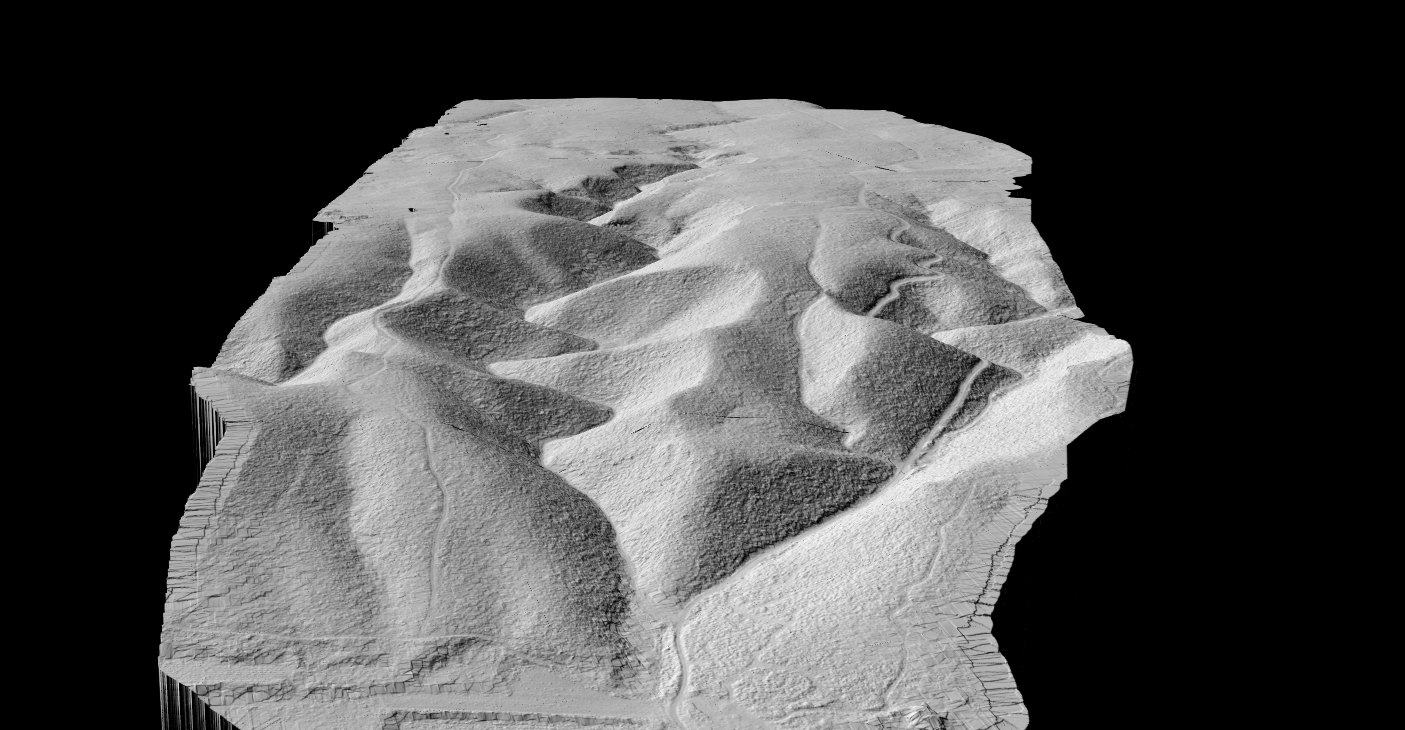
Mountainous regions showcase hillshade visualization at its best. The dramatic elevation changes create strong contrasts between illuminated slopes and shadowed valleys.
This example demonstrates how steep terrain features are clearly visible, from ridge lines to valley bottoms, making topographic interpretation intuitive even for non-specialists.
Applications
Cartography
Base layer for topographic maps showing terrain relief intuitively.
Archaeology
Revealing subtle features like ancient roads, walls, and structures.
Geomorphology
Analyzing landforms, fault lines, and erosion patterns.
Hydrology
Visualizing drainage patterns and watershed boundaries.
Valley Terrain Analysis
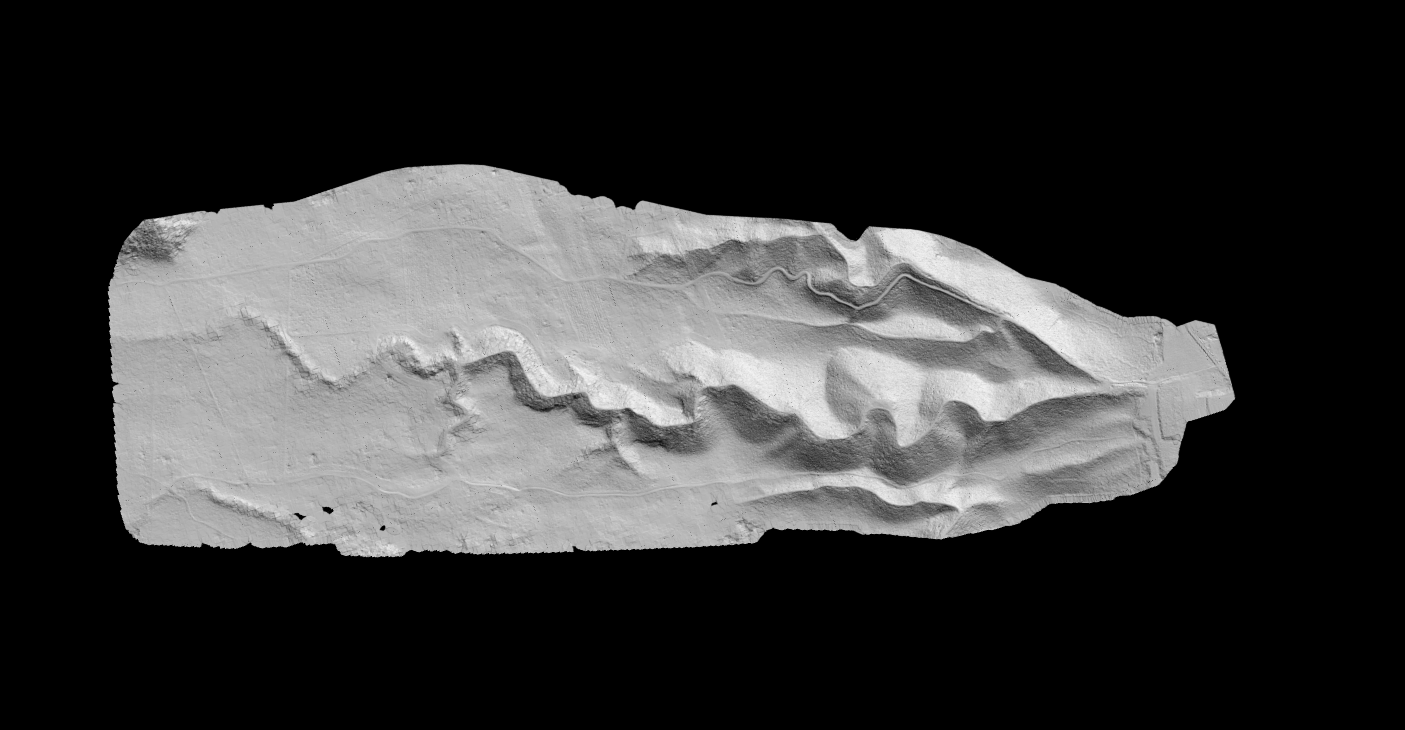
Hillshade visualization excels at revealing subtle terrain features in valley systems that might be missed in standard elevation maps.
Drainage patterns, terraces, and gentle slope changes become clearly visible, making hillshade invaluable for hydrological analysis, flood modeling, and land use planning.
Agricultural Land Mapping
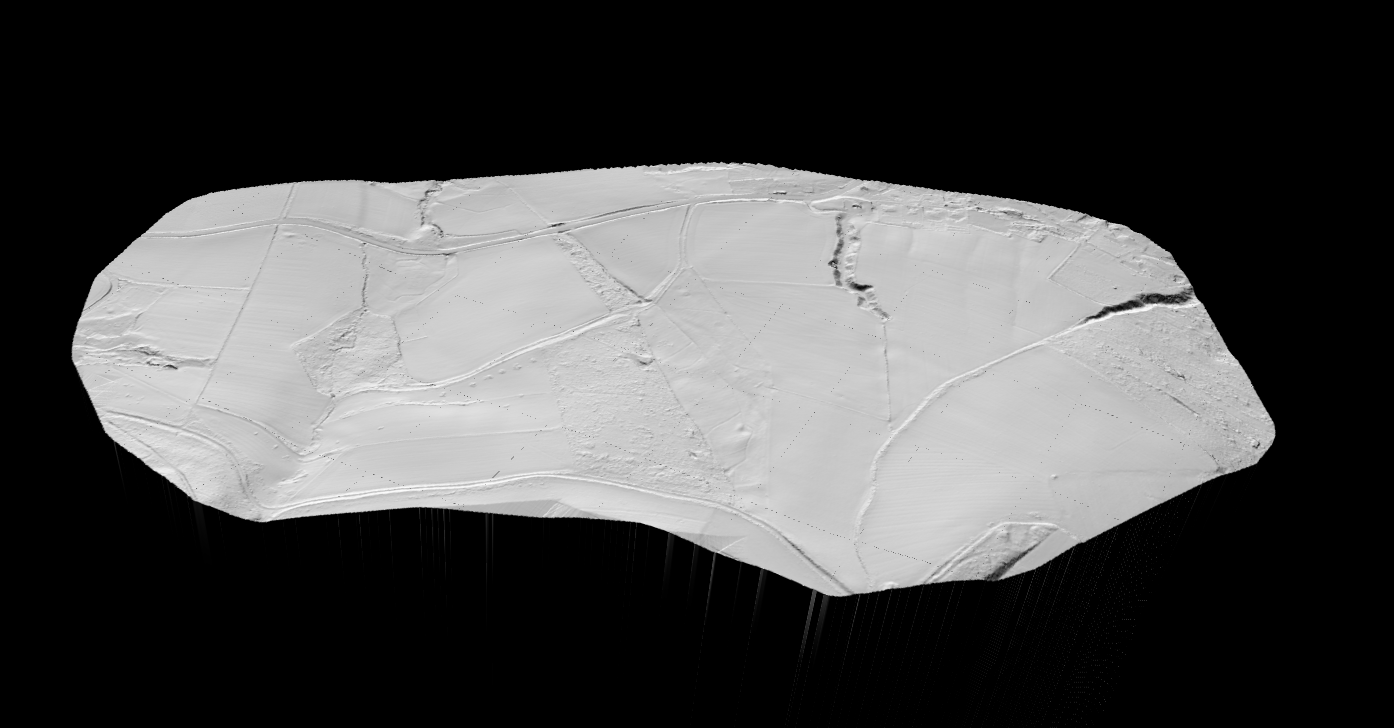
Even in relatively flat agricultural areas, hillshade reveals important terrain details. Field boundaries, irrigation channels, and micro-topography become visible.
This helps with precision agriculture, drainage planning, and understanding how water flows across farmland.
Related Articles
Terrain & Elevation
• DTM Guide • DSM Guide • DEM Guide • DTM vs DSM • What is Hillshade?
Point Cloud Classification
• Classification Guide • Classification Codes • Classification Methods • What is Classification? • Classification Software
Generate Hillshade from Your LiDAR Data
LidarVisor generates DTM and DSM products from your point cloud data — including ready-made hillshade visualizations. Upload your LAS/LAZ files and download hillshade rasters alongside your terrain products.