
Learn LiDAR
What Is a Hillshade Map? LiDAR Examples, Uses & Terrain Shading
How hillshade maps make subtle terrain, drainage, and landform patterns easier to read
No credit card required • 50 hectares included
A hillshade map is a shaded-relief image created from a DTM, DEM, or other elevation model by simulating how light falls across terrain. In LiDAR workflows, hillshade maps help surveyors, archaeologists, planners, and GIS teams spot ridges, embankments, drainage features, and subtle terrain changes faster than raw elevation numbers alone.
This guide explains how hillshade mapping works, when to use it, and how to generate a hillshade from LiDAR data.
How Hillshade Works
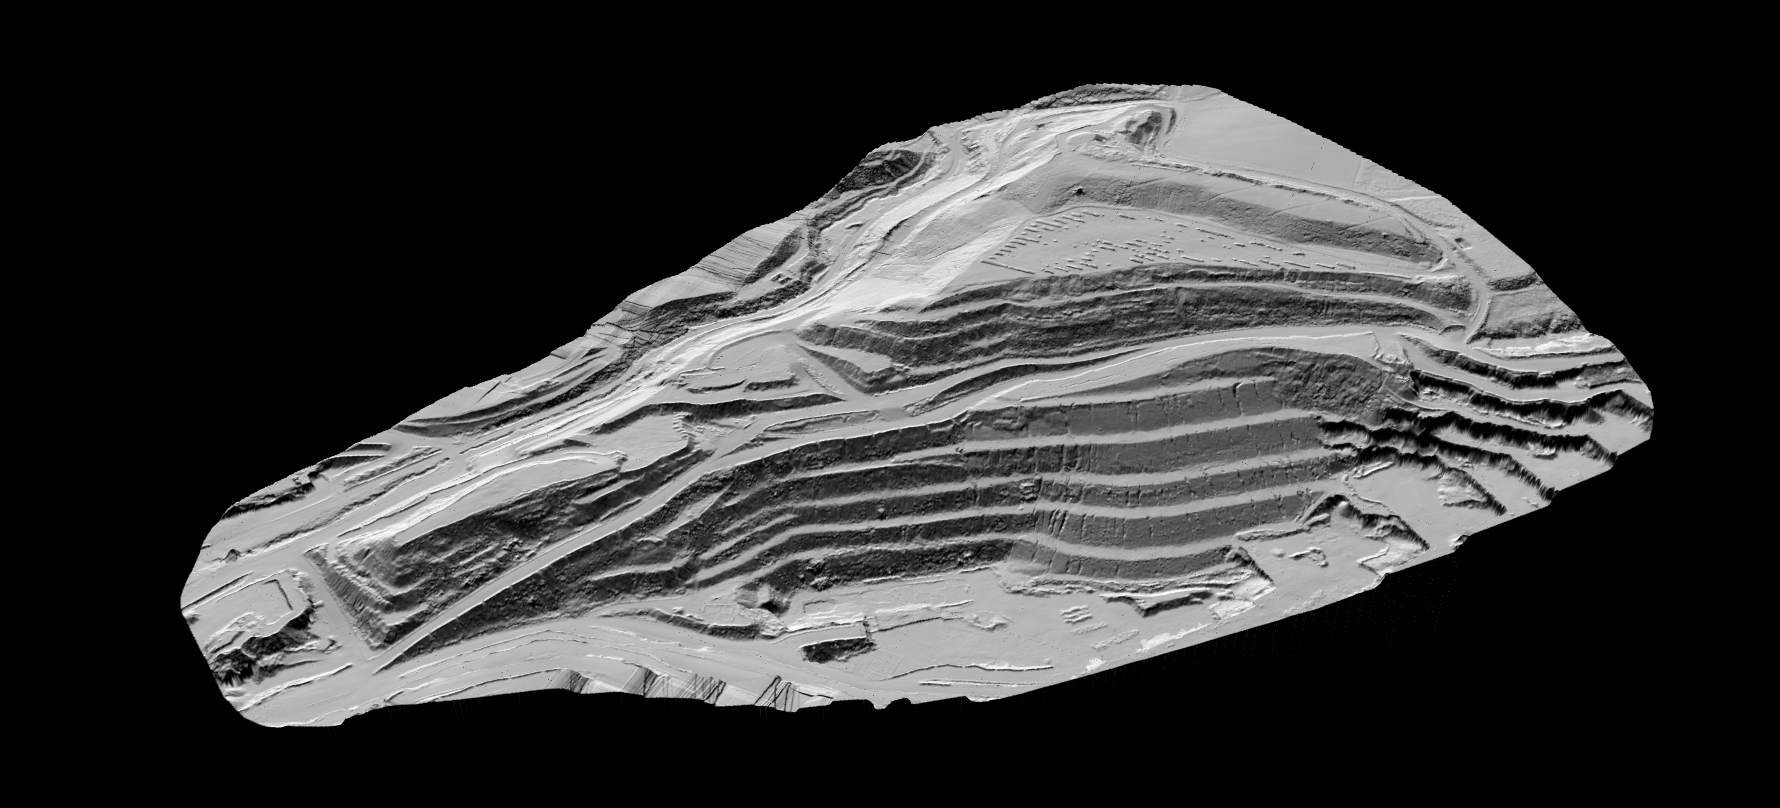
The algorithm places a virtual sun at a specific position in the sky, defined by two angles:
- Azimuth (compass direction, typically 315° for northwest)
- Altitude (height above horizon, typically 45°)
For each cell in the elevation model, it calculates the angle between the surface normal and the incoming light rays. Surfaces facing the sun render bright; surfaces facing away render dark; surfaces at oblique angles render in intermediate grays.
Why Hillshades Are So Effective
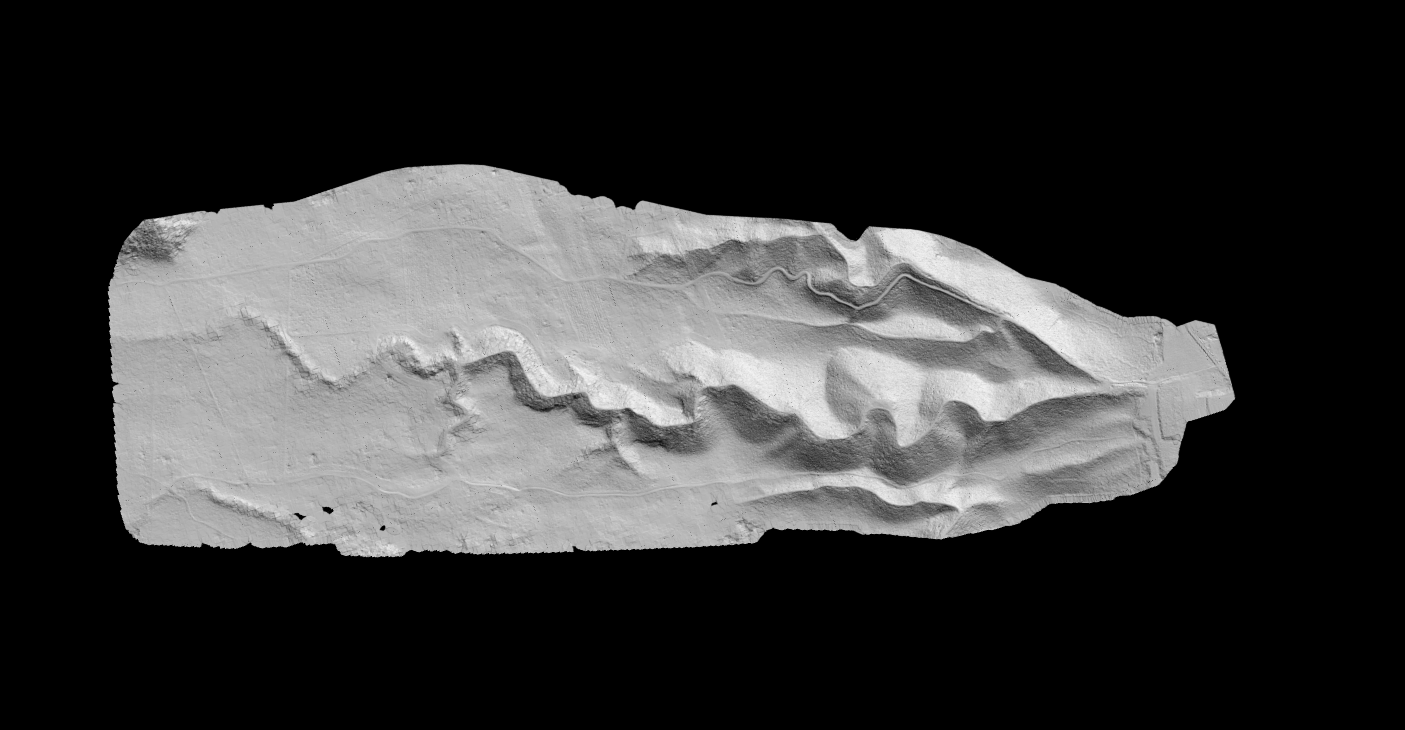
This simple calculation produces remarkably effective visualizations. Subtle features that are invisible in raw elevation numbers pop into view when illuminated from the side
Ancient Features
Ancient field boundaries, archaeological sites, and historical structures become visible through subtle elevation changes.
Geological Structures
Fault lines, erosion patterns, and geological formations appear clearly when shadowed by virtual sunlight.
Human Intuition
The human visual system is extremely good at interpreting shaded relief, making hillshades one of the most powerful ways to communicate terrain.
Applications
Hillshade maps serve professionals across multiple disciplines
Cartography
Cartographers use hillshades as base layers that give maps depth and context, making topographic information intuitive at a glance.
Geology
Geologists identify structural features and fault lines that would be invisible in raw elevation data or traditional contour maps.
Archaeology
Archaeologists have discovered countless sites, from Roman roads to medieval settlements, by examining hillshaded LiDAR data of forested areas.
Hillshades with LidarVisor
LidarVisor generates hillshade visualizations automatically from your DTM.
View them draped over 3D terrain or export high-resolution images for use in reports, presentations, and GIS projects.
For reports and presentations, a well-rendered hillshade communicates terrain more effectively than any table of numbers.
Related Articles
Terrain & Elevation
• DTM Guide
• DSM Guide
• DEM Guide
• DTM vs DSM
• Hillshade Maps
Point Cloud Classification
• Classification Guide
• Classification Codes
• Classification Methods
• What is Classification?
• Classification Software
Ready to Visualize Your Terrain?
Upload your LiDAR data and generate stunning hillshade maps automatically. Start with 50 hectares of free processing.
Create free account50 hectares free. No credit card. No software to install.