
Learn LiDAR
LiDAR Resolution: Complete Guide to Point Density, Spatial Resolution, and Quality Levels
LiDAR resolution determines how much detail your point cloud captures.
No credit card required • 50 hectares included
Whether you’re planning a survey, evaluating data quality, or choosing a sensor, understanding resolution is essential for getting the results your project requires.
What Is LiDAR Resolution?
LiDAR resolution refers to the level of detail captured in a point cloud. Higher resolution means more points per unit area, allowing you to detect smaller features and create more detailed terrain models.
Resolution is primarily determined by point density, which measures how many laser pulses hit each square meter of ground. However, resolution also depends on other factors like positional accuracy and the ability to distinguish surfaces at different elevations.
Point Density: The Core Resolution Metric
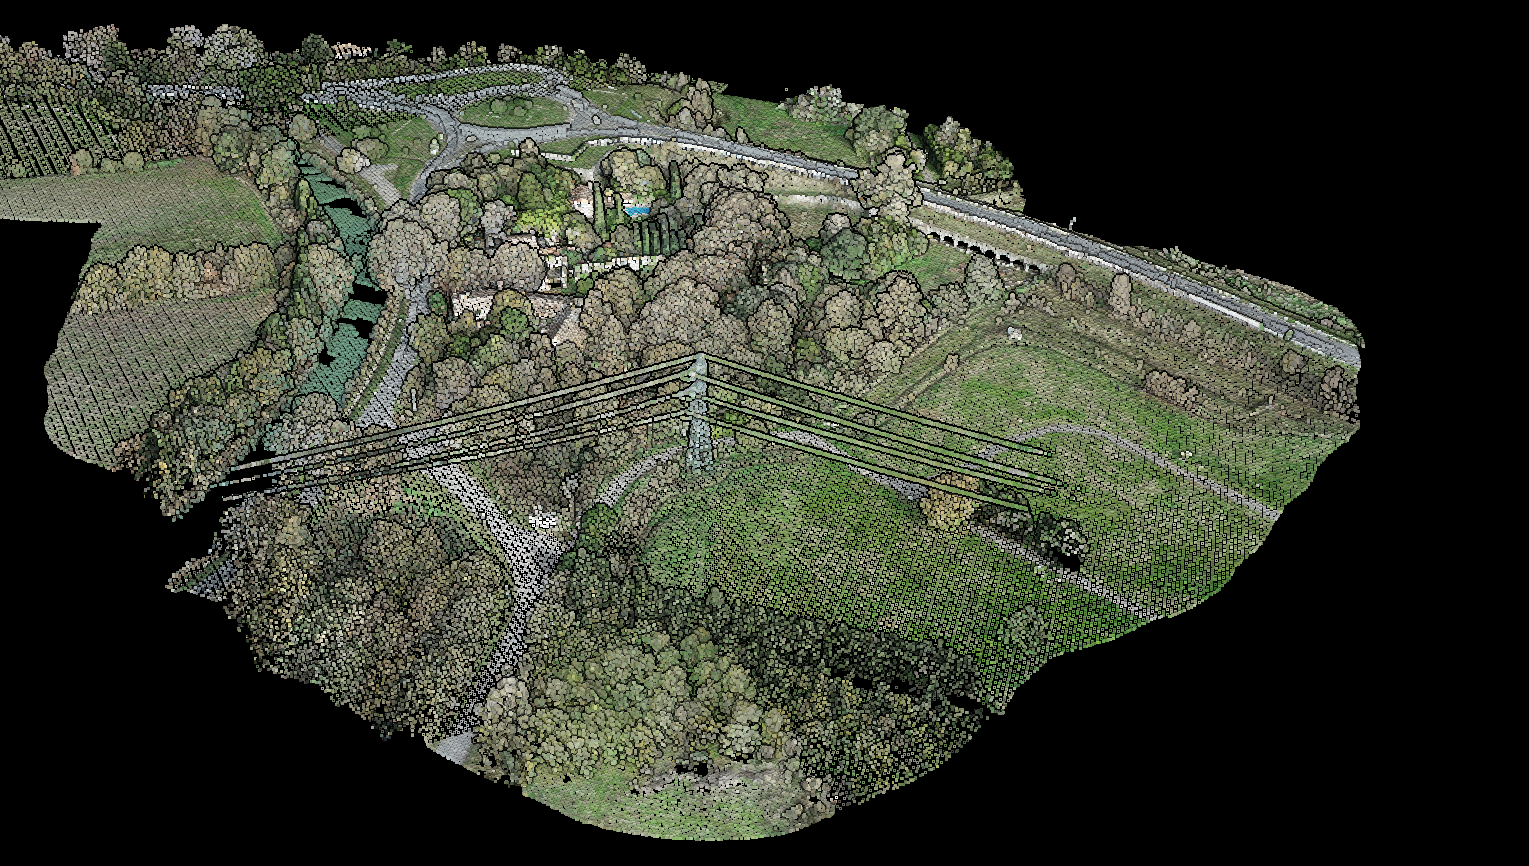
Point density is expressed as points per square meter (pts/m²) or pulses per square meter (ppsm). It’s calculated by dividing the total number of points by the surveyed area.
A related measurement is nominal point spacing (NPS), which represents the average distance between neighboring points:
Point Spacing = √(1 / Point Density)
- 8 pts/m² = 0.35 m point spacing
- 4 pts/m² = 0.50 m point spacing
- 2 pts/m² = 0.71 m point spacing
- 1 pt/m² = 1.00 m point spacing
USGS Quality Levels and Point Density Requirements
The U.S. Geological Survey (USGS) 3D Elevation Program (3DEP) defines quality levels that specify minimum point density and accuracy for topographic LiDAR data
| Quality Level | Min. Density | Point Spacing | Vertical Accuracy | Typical Use |
|---|---|---|---|---|
| QL0 | ≥8 pts/m² | ≤0.35 m | 5 cm RMSE | High-detail engineering, powerlines |
| QL1 | ≥8 pts/m² | ≤0.35 m | 10 cm RMSE | Detailed terrain, urban mapping |
| QL2 | ≥2 pts/m² | ≤0.71 m | 10 cm RMSE | Standard topographic mapping |
| QL3 | ≥0.5 pts/m² | ≤1.41 m | 20 cm RMSE | Legacy data, broad area coverage |
Most modern airborne LiDAR acquisitions target QL1 or QL2 specifications. QL0 is reserved for applications requiring maximum detail, such as utility corridor surveys or detailed engineering projects.
Factors Affecting LiDAR Resolution
1. Pulse Rate (PRF)
The pulse repetition frequency determines how many laser pulses the sensor emits per second. Modern airborne LiDAR sensors operate at 200,000 to 2,000,000+ pulses per second. Higher pulse rates allow for denser point clouds at the same flight speed.
2. Flying Altitude
Lower flying altitude means smaller footprint size and higher point density. However, lower altitudes require more flight lines to cover the same area, increasing acquisition cost.
3. Aircraft Speed
Slower flight speeds result in higher point density along the flight direction. Drone-based LiDAR typically achieves higher densities than manned aircraft due to slower speeds and lower altitudes.
4. Scan Angle and Pattern
Narrower scan angles concentrate points in a smaller swath, increasing density but reducing coverage efficiency. Different scan patterns (oscillating mirror, rotating polygon, fiber scanner) affect how points are distributed across the swath.
5. Beam Divergence
The laser beam spreads as it travels, creating a footprint on the ground. Smaller footprints allow for finer spatial resolution and better separation of closely spaced features. Typical footprint diameters range from 10 cm (drone) to 30+ cm (high-altitude airborne).
Resolution Requirements by Application
Different applications require different resolution levels. Here are recommended point densities for common use cases
| Application | Recommended Density | Why |
|---|---|---|
| Utility vegetation management | 8-50+ pts/m² | Detect wires, measure clearances to branches |
| Building footprint extraction | 4-8 pts/m² | Define roof edges and structure outlines |
| Forestry (individual trees) | 8-25 pts/m² | Delineate tree crowns, measure heights |
| Flood modeling (DTM) | 2-4 pts/m² | Capture terrain for hydraulic models |
| Topographic mapping | 2-8 pts/m² | Generate contours, slope analysis |
| Corridor surveys (roads, rail) | 8-20 pts/m² | Asset inventory, clearance verification |
| Archaeology | 8-25 pts/m² | Detect subtle terrain features under canopy |
| Mining/stockpile | 4-10 pts/m² | Volume calculations, pit design |
Resolution vs. Accuracy
Resolution and accuracy are often confused but measure different things:
- Resolution = How much detail is captured (point density)
- Accuracy = How close measurements are to true positions
You can have high resolution with low accuracy (many points in wrong positions) or low resolution with high accuracy (few points but precisely located). Quality projects require both.
For terrain modeling, high accuracy is often more critical than high resolution. A 2 pts/m² dataset with 5 cm vertical accuracy will produce a better DTM than a 10 pts/m² dataset with 30 cm accuracy.
Calculating Resolution for DEM Production
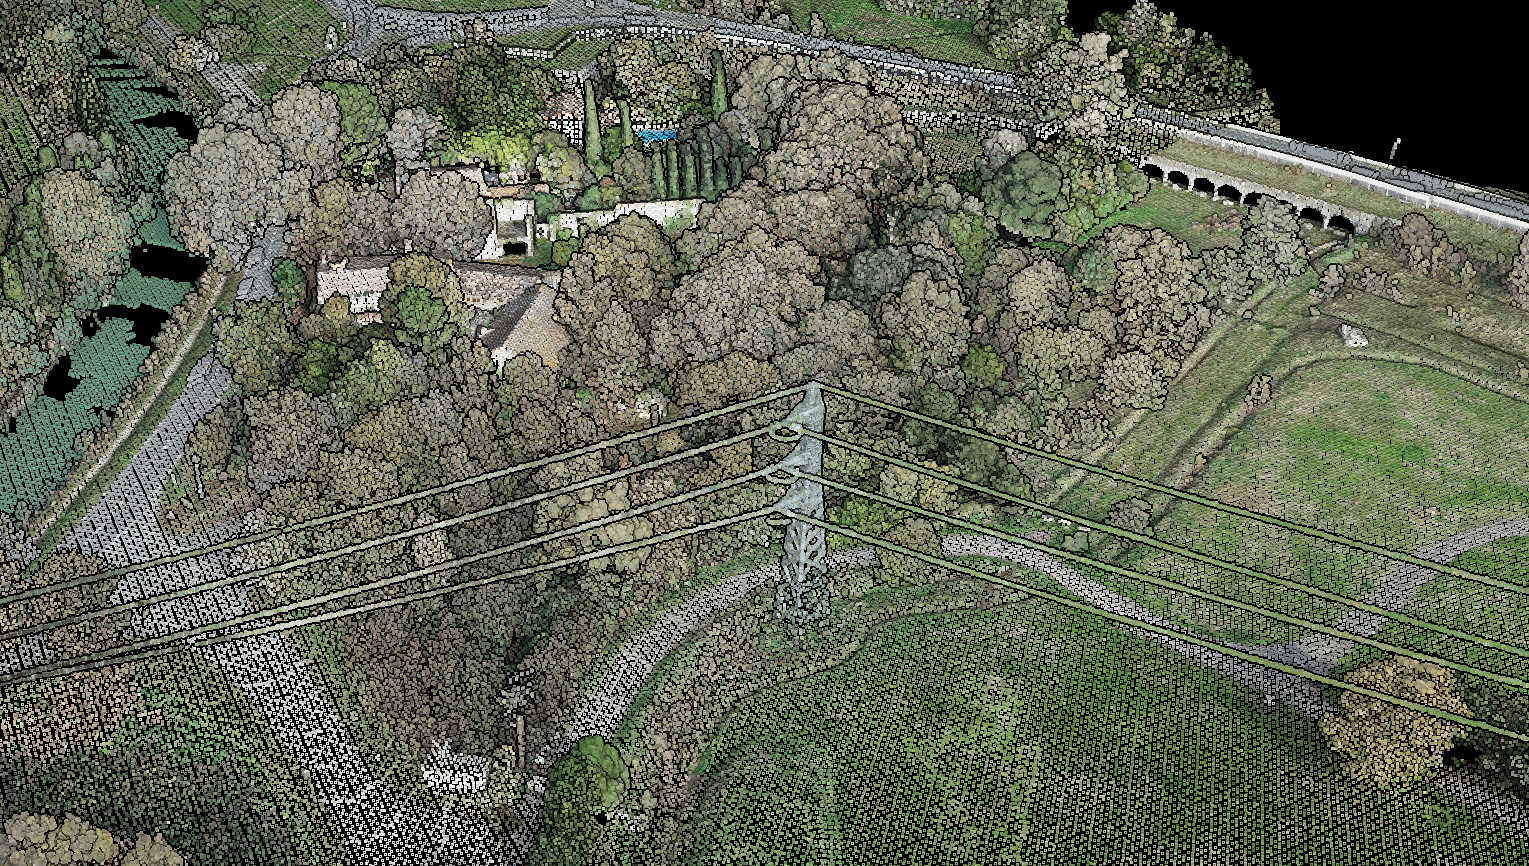
When generating raster products like DTMs and DSMs, resolution matters for choosing appropriate cell size. A common rule is to set DEM cell size to approximately the nominal point spacing:
- 8 pts/m² → 0.35 m cell size (or round to 0.5 m)
- 4 pts/m² → 0.5 m cell size
- 2 pts/m² → 0.7-1.0 m cell size
Using finer cell sizes than point spacing creates artificially smoothed surfaces. Coarser cell sizes waste available detail.
How Lidarvisor Handles High-Resolution Data
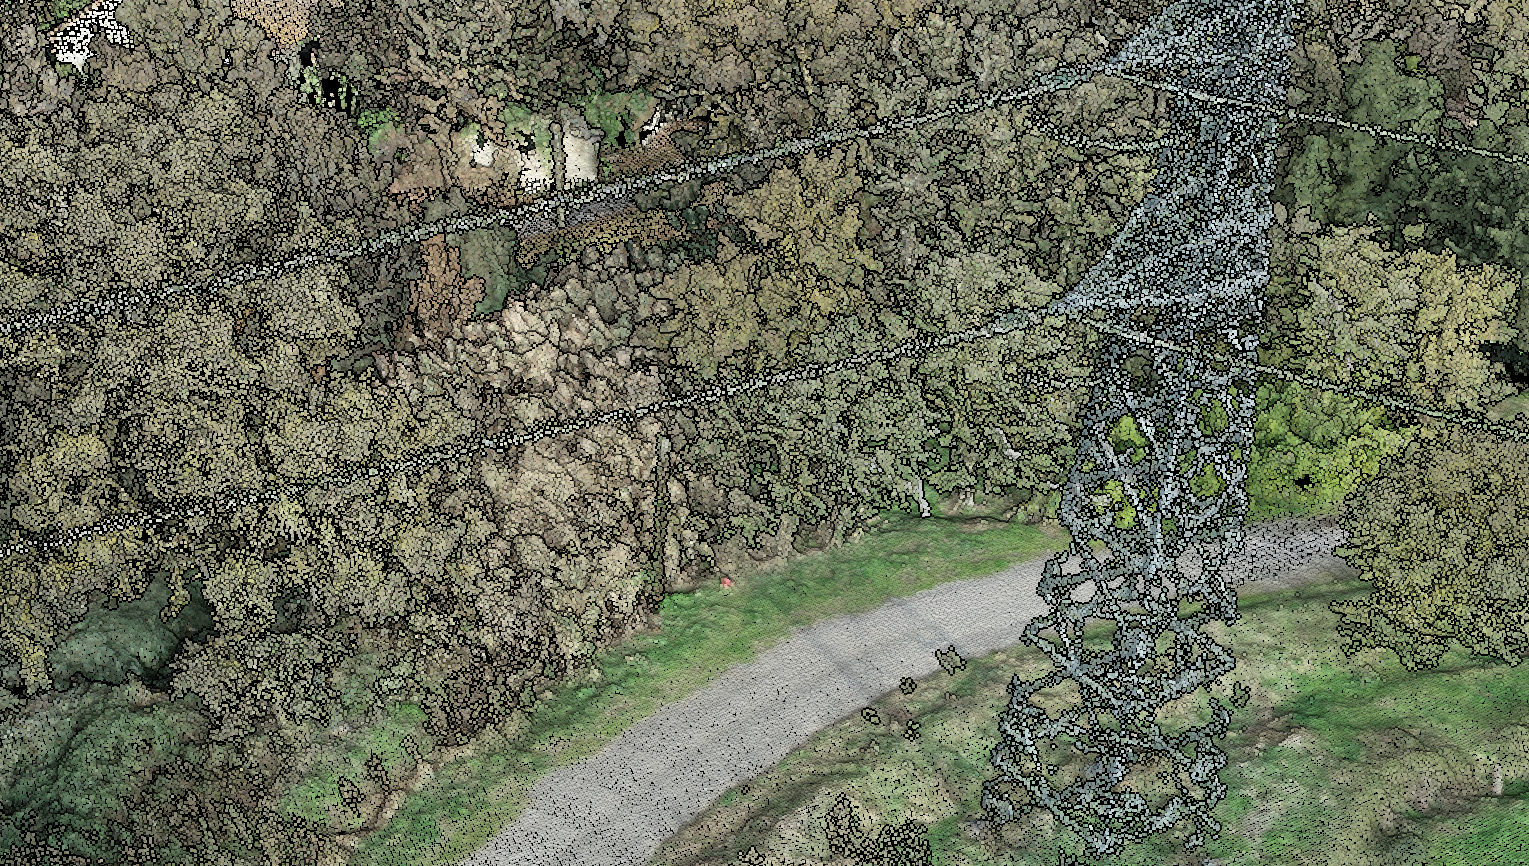
Lidarvisor processes point clouds of any density, from standard 2 pts/m² topographic surveys to dense 100+ pts/m² drone datasets. The AI classification model adapts to point density automatically, without requiring parameter adjustments.
- Large file support — Free tier handles LAS files up to 5 GB; the Advanced plan supports LAS files up to 250 GB (50 GB for LAZ)
- Automatic classification — Works across point density ranges
- Customizable DTM/DSM resolution — Choose output cell size
- Contour intervals — Set major/minor spacing to match project requirements
- Tree crown delineation — Works with forestry-grade densities (8+ pts/m²)
Specifying Resolution for Your Project
When contracting a LiDAR survey or evaluating existing data, specify:
- Minimum point density (pts/m² in final, classified dataset)
- Aggregate or single return — Aggregate includes all returns; first return only may be sparser
- Ground point density — For terrain modeling, specify ground class density separately
- Uniformity requirements — No data voids larger than X meters
- Quality level reference — USGS QL1, QL2, or custom specification
Ready to Process Your Point Cloud?
Lidarvisor handles any point density, from 2 pts/m² topographic surveys to 100+ pts/m² drone data. Upload your LAS/LAZ file and get AI-powered classification in minutes.
Create free account50 hectares free. No credit card. No software to install.