Infrastructure
• Bridge & Road Inspection
• Powerline Extraction
• Construction
Related Industry Applications
Natural Resources
• Forest Inventory
• Vegetation Management
• Utility VegMgmt
Geospatial
• Surveying
• Terrain Mapping
• Archaeology
What LiDAR Measures
LiDAR pulses penetrate forest canopy, recording multiple returns as they pass through leaves and branches to the ground. This vertical profile captures the three-dimensional structure of the forest.
From these returns, you can extract tree heights by comparing canopy top to ground level, map crown diameters by analyzing return clusters, and calculate canopy cover as the percentage of ground obscured by vegetation.
Combine these metrics with allometric equations and you can estimate timber volume, biomass, and carbon stock across entire forest stands.
Key Deliverables
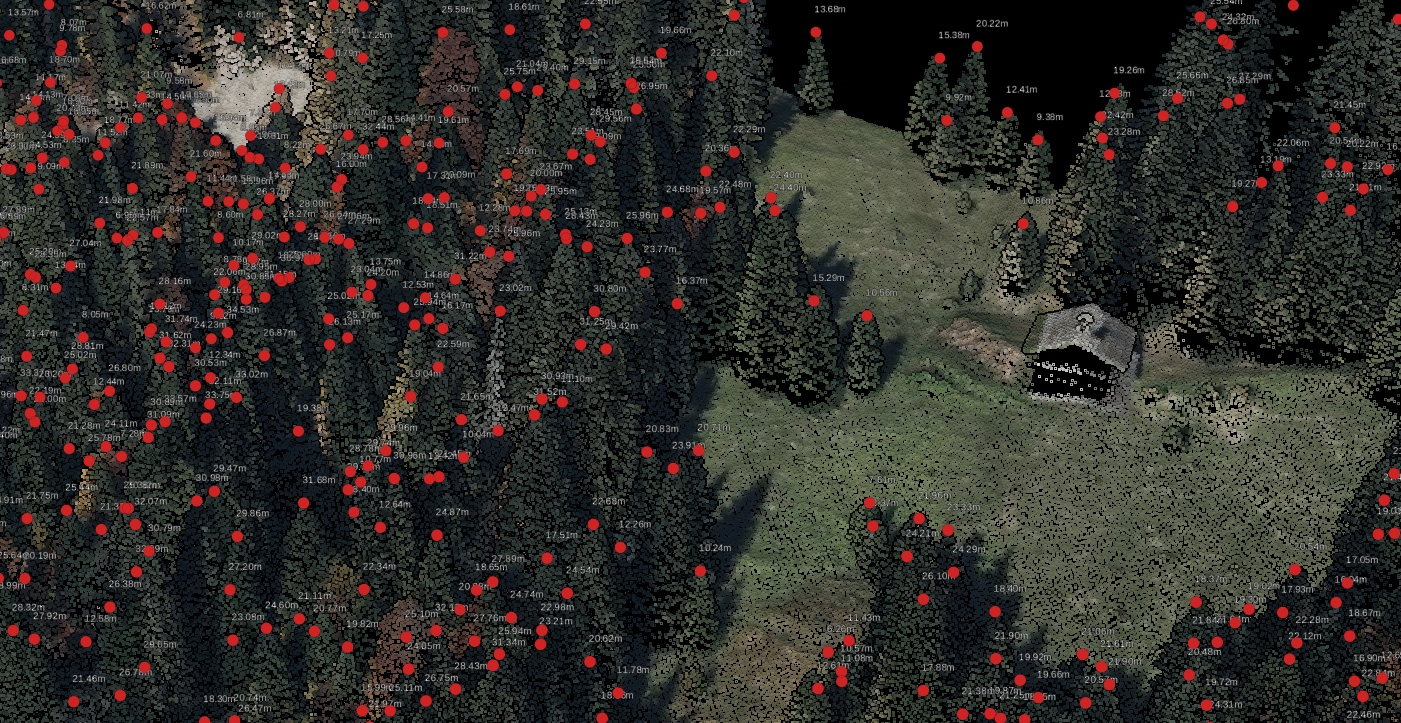
Individual tree top detection showing extracted stem locations across a forest stand.
Individual Tree Detection
Algorithms find local maxima in the CHM, identifying each stem’s location and height. You know the height distribution of every stand, not just the plots you sampled. This enables wall-to-wall inventory instead of extrapolation from limited samples.
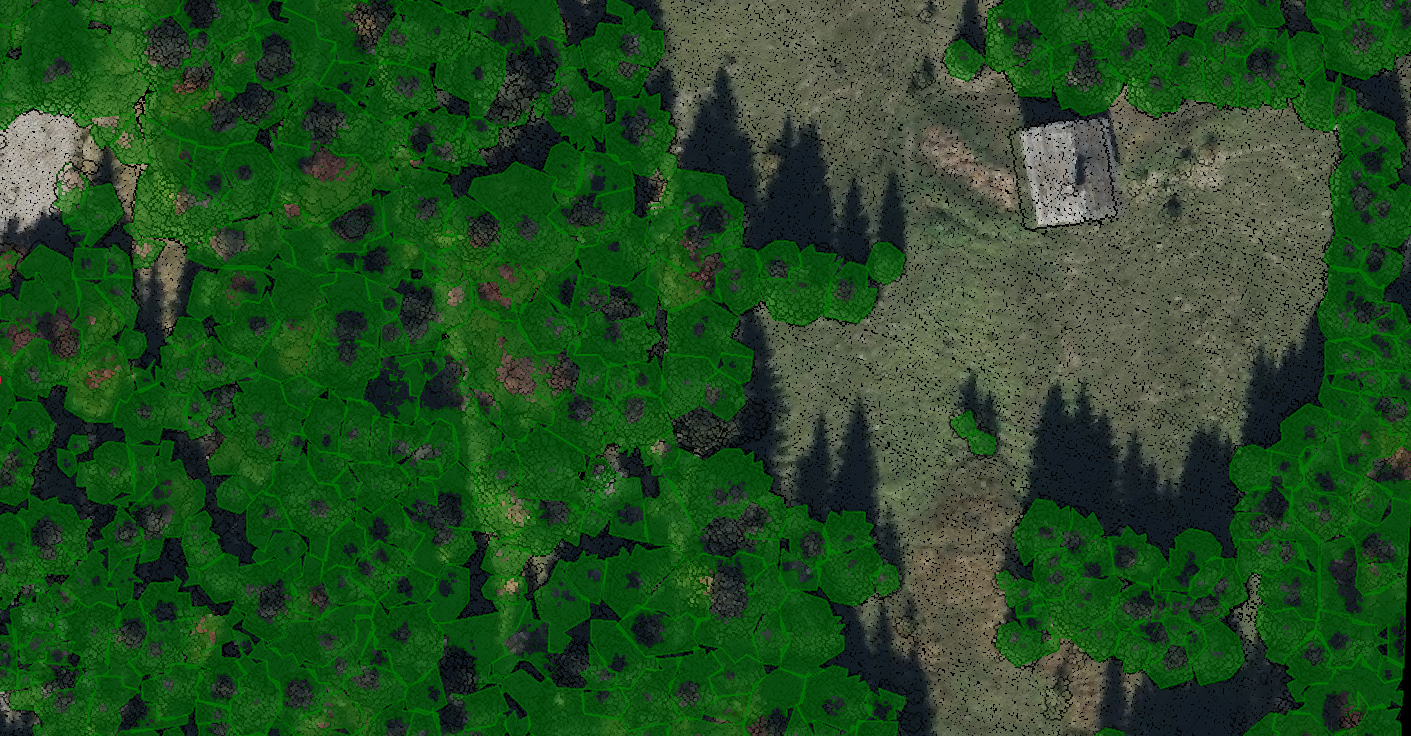
Crown Segmentation
Draws boundaries around each tree’s canopy to estimate crown area and competition between neighbors. Track changes over time by comparing surveys from different years.
Canopy Height Model (CHM)
Shows vegetation height across your survey area, revealing which stands are tallest and where young growth is emerging. Replaces sparse sample data with wall-to-wall measurements.
Carbon Stock Estimation
Convert tree heights to per-tree carbon estimates using species-specific allometric models. Lidarvisor supports 102 models across 8 geographic regions, outputting carbon (t C), CO₂ equivalent (t CO₂eq), and above-ground biomass (t AGB) for each tree.
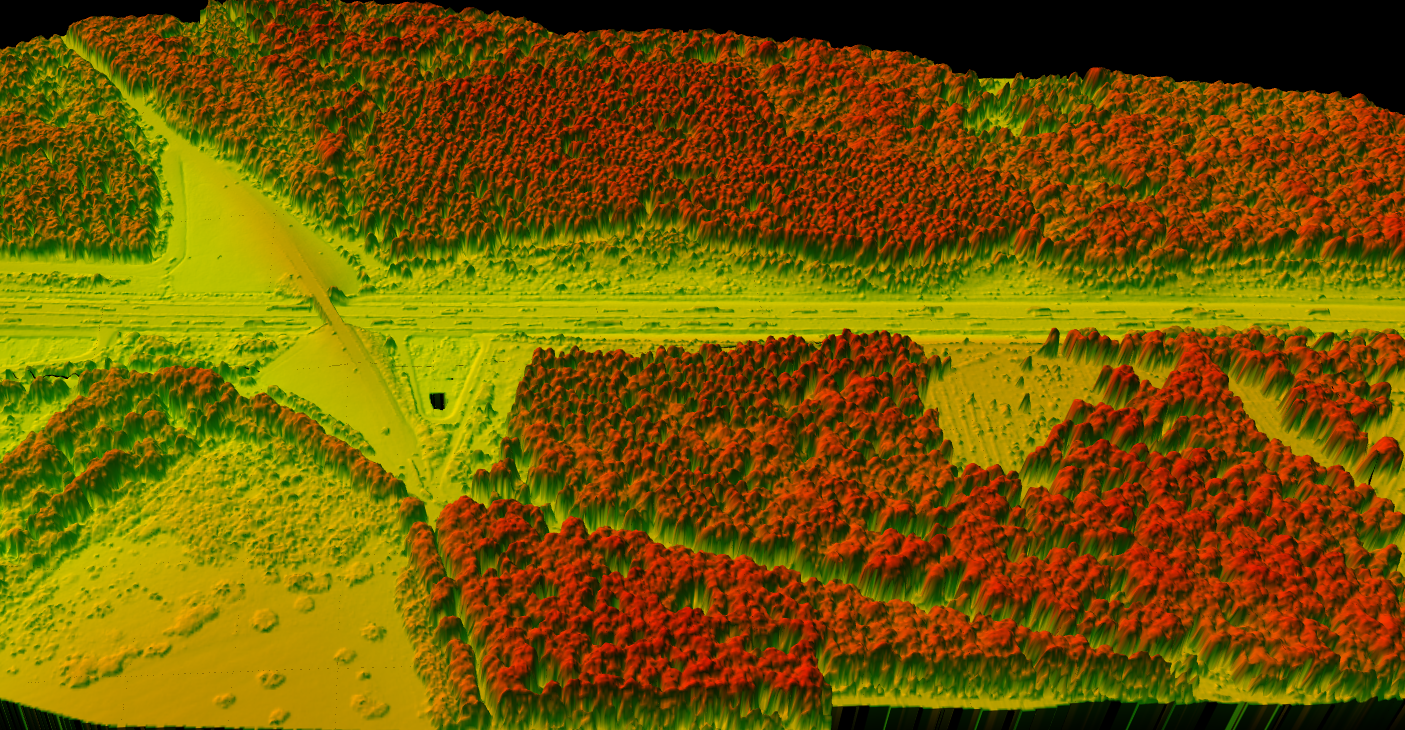
Canopy Height Model visualization of a forest corridor showing height variation.
3D visualization of forest canopy height data revealing stand structure.
3D Forest Structure Analysis
Three-dimensional visualization reveals forest structure patterns invisible in 2D maps. Identify canopy gaps, assess vertical stratification, and understand competition dynamics between neighboring trees. This perspective enables forest managers to make data-driven decisions about thinning, harvesting, and conservation.
Accuracy Considerations
LiDAR-derived forest metrics are highly accurate, but several factors affect quality:
- Dense canopy can prevent pulses from reaching the ground, affecting terrain model quality
- Small trees may not generate enough returns for reliable detection
- Point density matters: sparse data misses fine details that dense data captures
- Survey design should account for forest type, season, and flight parameters
Understanding these limitations helps you design surveys and interpret results appropriately.
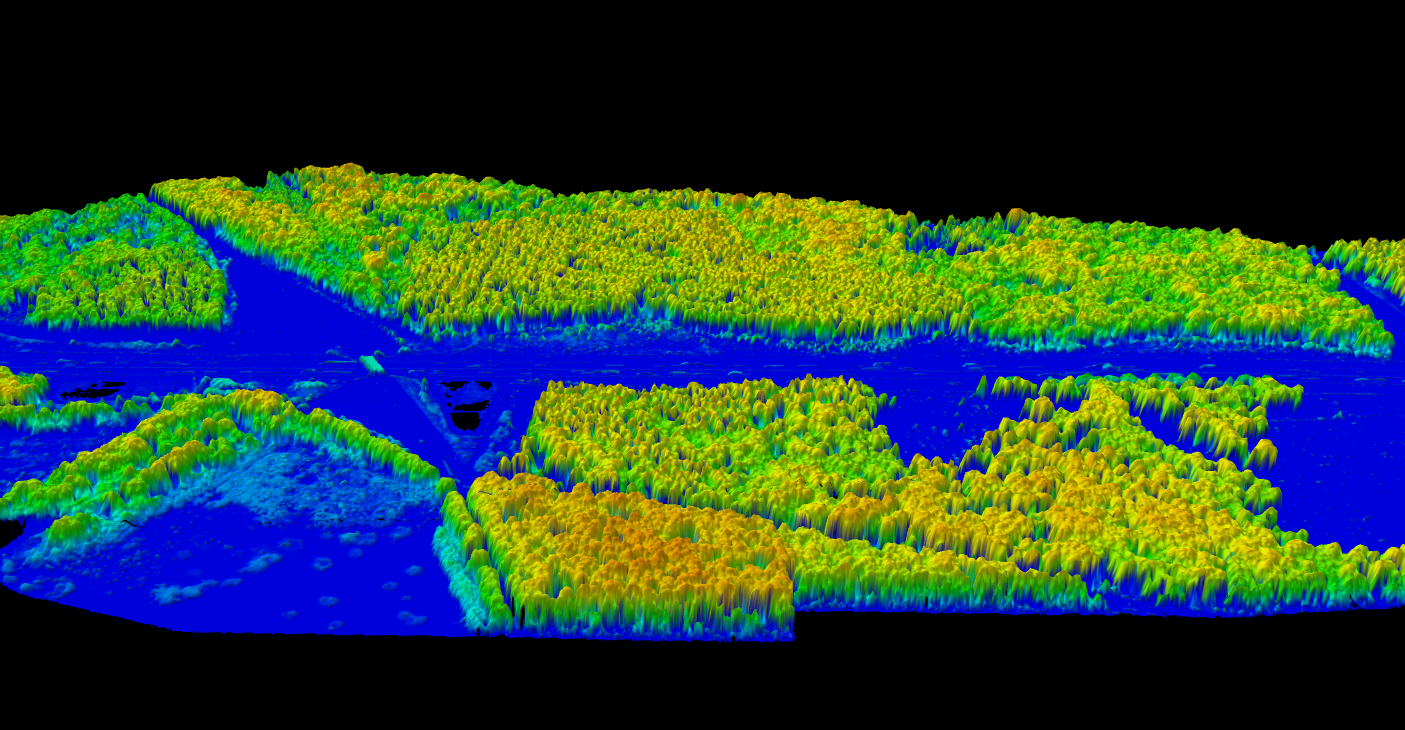
Forest Classification
Accurate point classification separates ground returns from vegetation, enabling precise terrain models beneath the canopy. Classification quality directly affects all derived products including canopy height models and biomass estimates. LidarVisor’s AI-powered classification handles complex forest structures automatically.
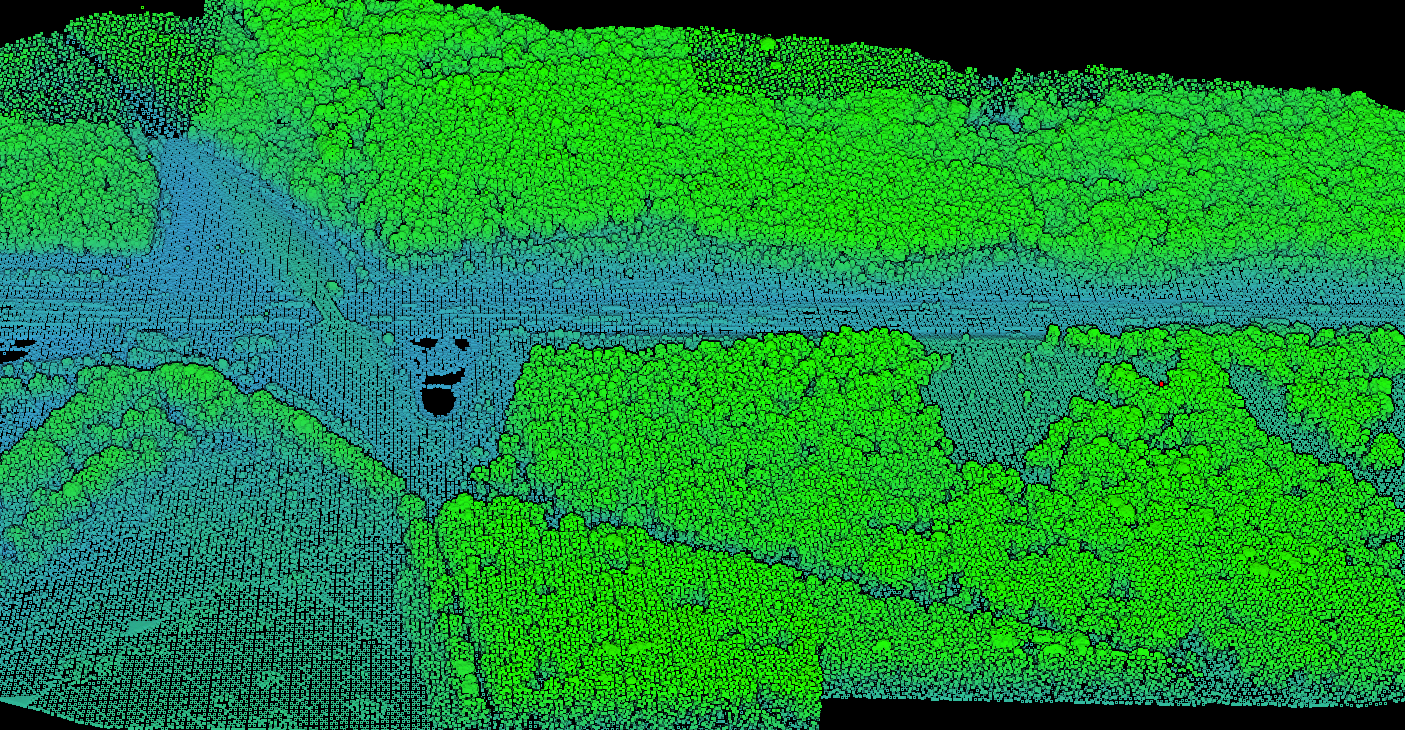
Point cloud classification of a forest corridor showing ground and vegetation separation.
Forest Analysis with Lidarvisor
Lidarvisor automates the forest inventory workflow. Upload your LiDAR data, and the platform classifies ground points, generates terrain and canopy height models, detects individual trees, and calculates height statistics.
Enable carbon estimation to get per-tree carbon stock, CO₂ equivalent, and biomass using 102 species-specific allometric models across 8 global regions. Export results as GIS-ready vectors, enhanced CSV with carbon columns, and PDF reports including a Carbon Estimation Summary page with IPCC-referenced methodology.
The entire process runs in the cloud with no software installation required.
Create a FREE account now and start processing your point cloud
Get 2 GB of storage space and classify up to 10 hectares for free.