
Learn LiDAR
Point Cloud to CAD
How to turn an aerial LiDAR point cloud into a DXF topographic map
No credit card required • 50 hectares included
The short answer
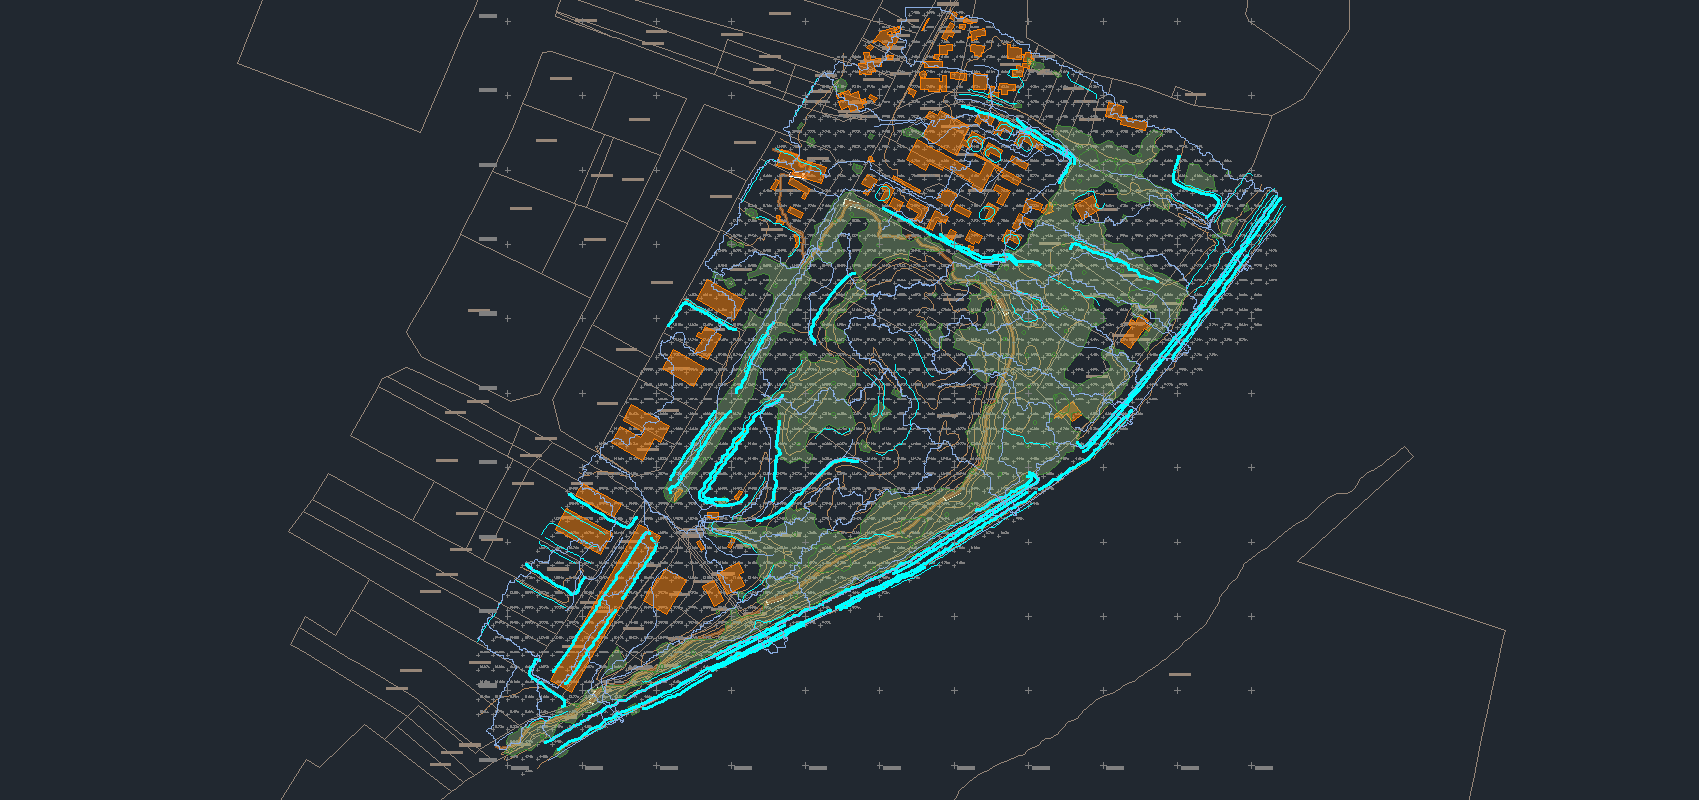
Converting an aerial LiDAR point cloud into a CAD drawing takes five steps. First you check that your data supports the drawing you have been asked for. Then you classify the cloud, so the software knows which points are ground, which are buildings and which are trees.
From the ground points you build a terrain model. From the terrain model and the classified points you extract vectors: contours, spot heights, building outlines, road edges and everything else the drawing needs. Finally you organise those vectors onto named layers and export them as DXF.
Classification is the step that decides the quality of everything after it. Get it right and the rest is mostly configuration.
Aerial LiDAR to CAD is not the same as scan to CAD
Search for “point cloud to CAD” and almost everything you find is about a different job. Most results cover terrestrial scanning: a tripod scanner or a handheld unit captures a building interior, and the goal is a 3D model of walls, floors, pipes and structure. That work is usually called scan to BIM, and it is measured in rooms.
Aerial LiDAR is a different problem with a different answer. Your scanner was on a drone or an aircraft looking down. Your survey area is measured in hectares, not rooms. Nobody wants a 3D model of a hillside.
What the client wants is a survey drawing: contour lines at a stated interval, spot heights, the outline of every building, the edge of the road, the watercourse, the trees, all correctly georeferenced and all on layers their own CAD template recognises. So the tools are different, the outputs are different, and advice written for scan to BIM will send you down the wrong path.
Before you start: what your data has to support
Point density
Density sets the smallest real feature you can honestly draw. Asking a sparse dataset for a fine contour interval does not give you more accuracy, it gives you a smoother lie. Choose the interval from the density you have, not from the brief.
Ground visibility
LiDAR measures what the pulse can reach. Under dense canopy, on a steep face or across still water, ground returns thin out and the terrain model becomes interpolation. Know where those areas are before you deliver.
Coordinate system and units
Your cloud carries a reference system and your client's template expects one too. Metres against US survey feet is the classic trap, because a drawing in the wrong unit looks completely plausible until somebody measures it.
File format
LAS and LAZ hold the same data, LAZ compressed. The compression is lossless, so working from LAZ costs you nothing but disk reads.
Step 1: Classification, the step that decides everything
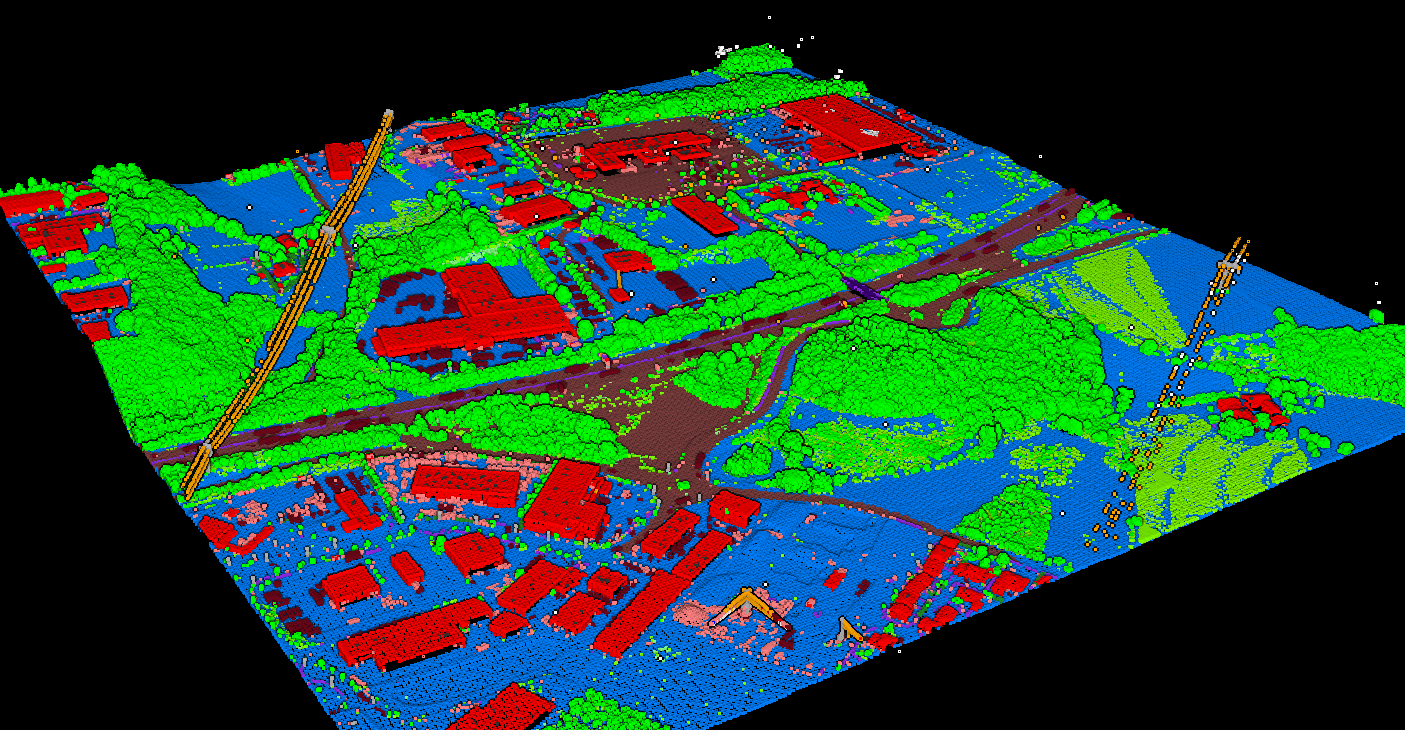
Classification assigns every point in the cloud a label describing what it hit. This is the foundation of the whole conversion, because every vector layer you extract later is derived from a class. Contours come from the ground points. Building outlines come from the building points. Tree crowns come from the high vegetation points.
If a wall is labelled vegetation, no amount of care at the export stage will put that building on your drawing. Modern classification is done by a machine learning model trained on aerial LiDAR rather than by hand-tuned filters.
The classes that matter for a topographic drawing
Ground
Bare earth, including pavement at ground level. The terrain model and every contour line is built from this class, so it is the one worth checking first.
Low, medium and high vegetation
Split by height so grass, scrub and trees are handled separately. High vegetation is what tree detection works from.
Building
Roof surfaces and structures, which become your building footprints.
Road surface
Paved and unpaved carriageway, which becomes the road layer.
Water
Lakes, rivers and ponds, which become water bodies and shorelines.
Rail
Railway track, extracted as its own layer, which matters on any corridor project.
Bridge deck
Bridge surfaces, which need separating from both the ground below and the road above.
Wire and transmission tower
Overhead conductors and the structures carrying them.
Pole
Utility poles, lighting columns and sign posts.
Vehicle
Cars and trucks, which you almost always want off the finished drawing.
Fence, wall and hedge
Boundary features, and often the ones a client notices are missing.
Noise
Erroneous returns above and below the real surface, excluded from everything downstream.
Where automatic classification still needs a human
Ground under dense canopy
Low returns in heavy woodland get read as low vegetation and the terrain model sags. This is the correction most worth making, because it moves your contours.
Roof edges and overhangs
Where a roof overhangs planting, the boundary between building and vegetation blurs and the footprint comes out ragged.
Vehicles on roads
A parked truck has roughly the height and shape of a small structure. Left alone it becomes a building on your drawing.
Low walls and terracing
A retaining wall a metre high sits between ground and structure, and different projects want it treated differently.
Good software lets you fix these by selecting points and reassigning them, using a brush, a height threshold, a colour range or an intensity range, rather than by editing anything point by point. Budget time for this pass. It is usually short, and it is the difference between a drawing that gets accepted and one that comes back.
Step 2: Build the terrain model
With the ground class correct, the terrain model is next. A Digital Terrain Model, or DTM, is a continuous surface representing bare earth, built by interpolating between ground points onto a regular grid. Two decisions matter.
Resolution. The grid cell size should follow your ground point density. Cells much smaller than the average spacing between ground returns do not add information, they just make a bigger file and a rougher surface that produces wobbly contours. Cells much larger than the spacing throw away detail you paid to collect.
What gets excluded. The DTM is built from ground points only. Buildings, vegetation and vehicles are excluded, which is exactly why classification had to come first. A surface that still includes roofs is a Digital Surface Model, a different product entirely, and contours drawn from it will run over the tops of buildings.
Everything downstream flows from this surface. Contour lines are traced from it. Spot heights are sampled from it. The elevation attached to a building footprint is read from it. A terrain model built on a misclassified ground surface produces a drawing where every elevation is quietly wrong, which is far more expensive than one where something is obviously missing.
Step 3: Vectorize, layer by layer
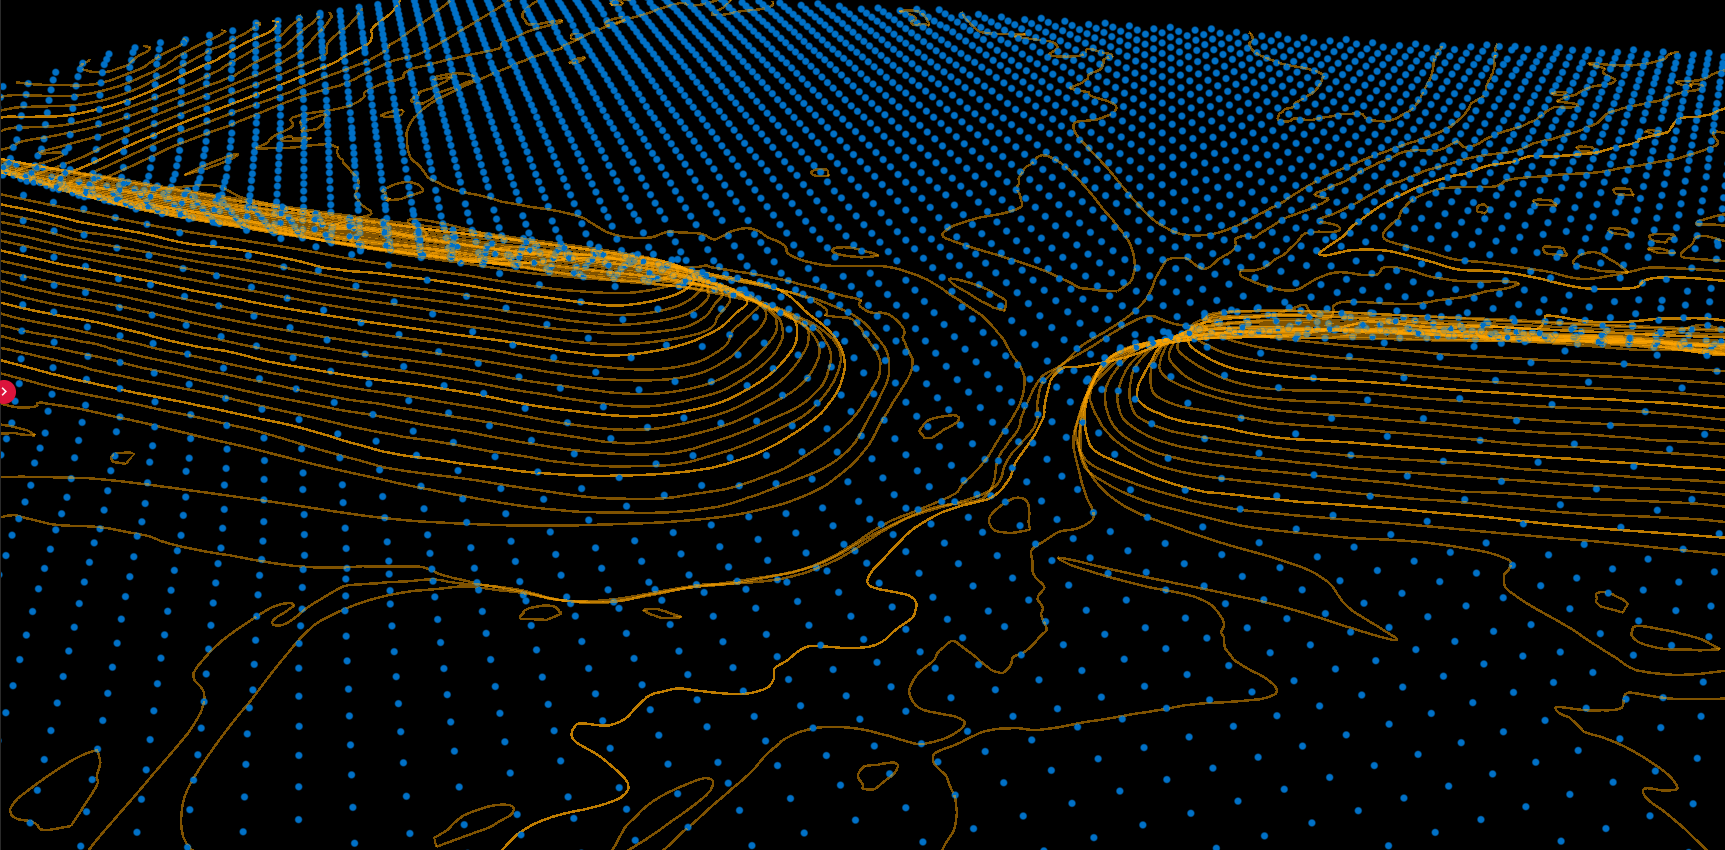
This is where the point cloud becomes drawing objects. Each layer is extracted independently, so you request only what the deliverable actually needs.
The layers you can extract
Major contours
The wider interval, normally the set carrying elevation labels. Kept on its own layer so it can be drawn heavier than the minor set.
Minor contours
The detail between the major lines. Separating the two is the whole point of the distinction, so they never share a layer.
Elevation grid
A regularly spaced point across the site, each carrying its height. These are your spot elevations, used for volumes and for checking a surface without tracing contours.
Building footprints
Polygons around each structure, with rural, urban and natural simplification modes. Each carries its height above ground, its area and the ground elevation beneath it.
Roads
Surfaces and edges, with modes for rural tracks and unpaved surfaces or for well defined urban carriageways and junctions.
Bridges
Separated out, because a bridge deck belongs neither to the ground surface below it nor to the buildings around it.
Rails
Railway track as its own layer, which matters on any corridor or infrastructure project.
Water bodies
Polygons for lakes, ponds and river surfaces, taken from the water class.
Shorelines
The boundary itself, delivered separately because a drawing often wants the line without the fill.
Tree tops
The position of each detected tree as a point, so individual trees can be scheduled and labelled.
Tree crowns
The extent of each canopy as a polygon, which is what a landscape or arboricultural drawing needs.
Vegetation areas
The schematic vegetation mass instead of individual trees, for when the drawing does not need them one by one.
Power lines
The conductors themselves in three dimensions, including the sag between supports.
Towers and poles
The structures carrying the conductors. With the wires, this pair is why many utility projects commission aerial LiDAR at all.
Cadastral parcels (reference only)
Parcel boundaries can be overlaid on the drawing, but they are fetched from a national cadastre service, not measured by LiDAR. Keep them on a clearly named and credited layer so nobody mistakes an administrative boundary for a surveyed one.
Choosing a contour interval
| Terrain | Major interval | Minor interval |
|---|---|---|
| Flat, under 10 m of relief | 1 m | 0.25 m |
| Gently rolling | 5 m | 1 m |
| Hilly | 10 m | 2 m |
| Mountainous | 25 m | 5 m |
A starting point rather than a rule. Confirm the interval against your actual ground point density before you commit to it.
All of these export as GeoJSON, Shapefile and DXF, so the same extraction serves a GIS handoff and a CAD handoff without reprocessing.
Step 4: Layers, units and the export itself
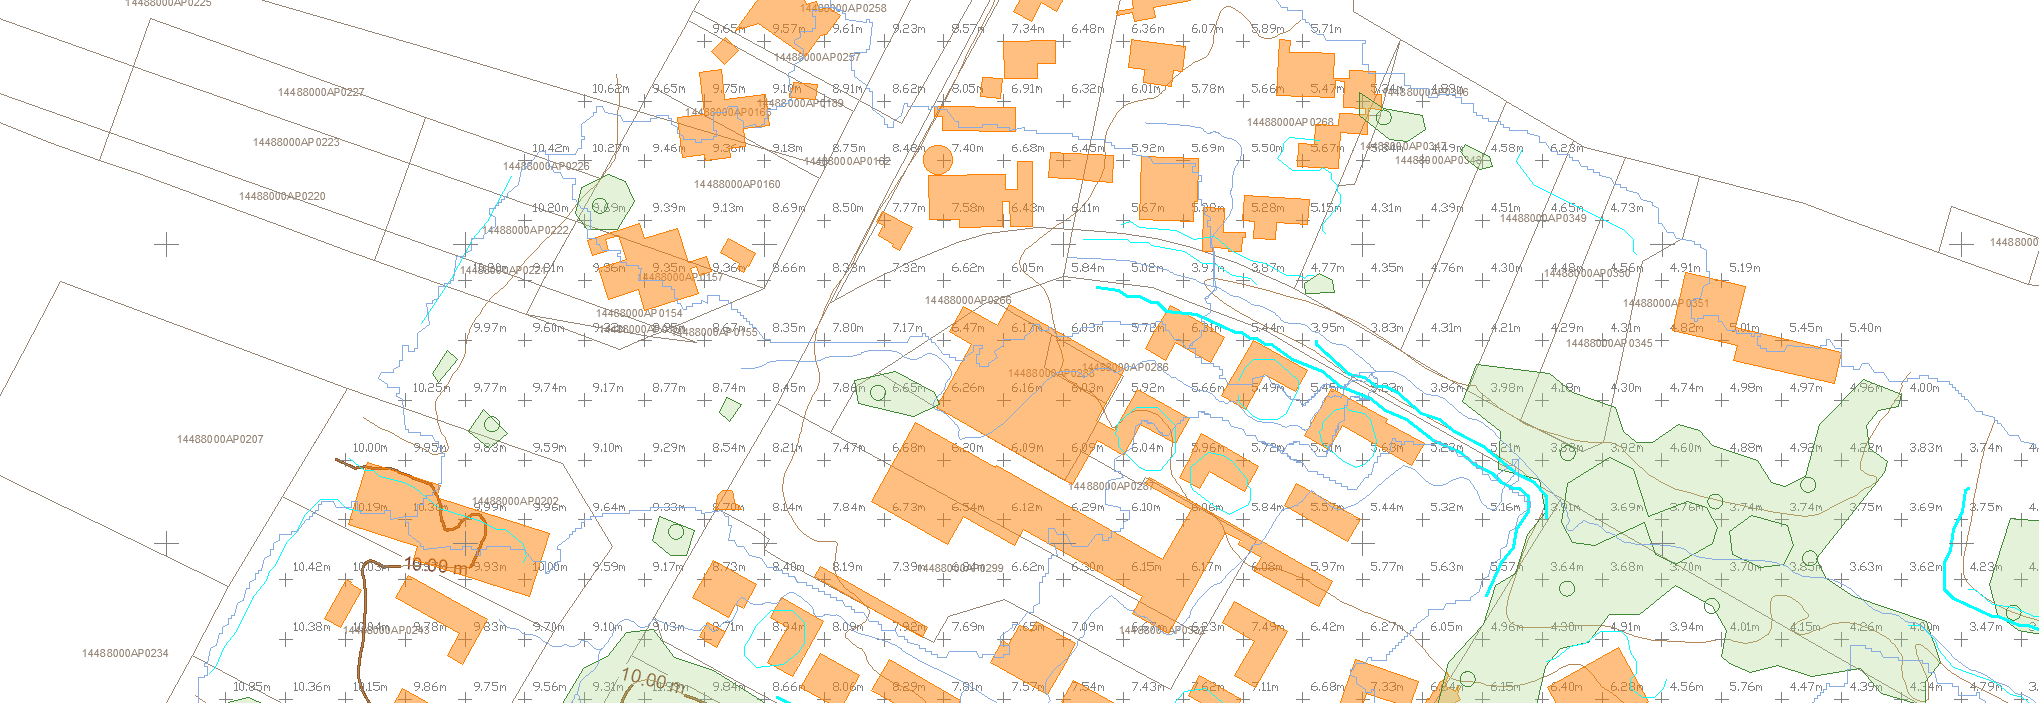
A DXF full of correct geometry on one layer called 0 is not a deliverable. The export is where the drawing becomes usable.
Layer organisation. Every feature type goes on its own named layer: major contours separate from minor, buildings separate from roads, each utility layer separate. If your client has a layer naming standard, apply it at export rather than asking them to remap twenty layers by hand.
2D or 3D. Contours and building outlines can be flat polylines at a stated elevation, or true 3D polylines carrying Z. A drafting workflow usually wants 2D with elevation as an attribute or a label. An engineering workflow modelling surfaces wants the Z. Decide before you export, because converting afterwards is tedious.
Coordinates and units. Confirm the exported drawing is in the coordinate system and the unit your client's template expects, then open the file and measure a known distance. This takes a minute and catches the error that otherwise gets discovered by somebody else, later, at your expense.
Format choice. DXF is the interchange format and opens everywhere, which is why it is the sensible default for a handoff. Shapefile suits a GIS recipient. GeoJSON suits anything web based. Send the format the recipient actually works in.
Step 5: Check it in CAD before you send it
Open the drawing and work through this list. It takes a few minutes and it catches nearly everything.
- Do contour lines cross each other? They physically cannot. Crossings mean a problem in the terrain surface, usually a classification error.
- Are contours running across building roofs? Your surface is a DSM rather than a DTM, or buildings were not excluded.
- Do buildings sit at sensible ground elevations? A structure floating above or sunk below the terrain points at a classification or interpolation problem.
- Measure a known distance. This catches the unit and coordinate system errors.
- Are all the layers present and named correctly? Compare against what you agreed to deliver, not against what came out of the export.
- Is anything on the drawing that should not be? Vehicles, noise returns and temporary site objects are the usual suspects.
- Does the drawing sit in the right place? Overlay it on a known reference and confirm the origin.
Doing this in Lidarvisor
Upload
Bring in your LAS or LAZ file from an aerial survey.
Classify
Classify automatically, then correct anything that needs it using the selection tools in the 3D viewer.
Vectorize
Choose your terrain resolution, contour intervals and the vector layers your drawing needs.
Download
Export DXF for CAD, or Shapefile and GeoJSON for GIS.
Because the classification, the terrain model and the vectors are all produced in one pass, changing your contour interval or adding a layer does not mean starting again. New accounts include 50 hectares of free processing, which is enough to run a real site end to end and see the DXF before deciding anything.
Frequently asked questions
Can you import a point cloud directly into AutoCAD?
You can attach a point cloud to a drawing for reference, and AutoCAD will display it. That is not the same as converting it. An attached cloud is millions of points you can look at and snap to, not contour lines, footprints and layers you can edit, label and issue. Producing those is what the process on this page does.
Is LiDAR the same thing as a point cloud?
No. LiDAR is the measurement technique: a laser pulse is timed to a surface and back. A point cloud is one way of storing the result, and it can come from other techniques too, including photogrammetry. All aerial LiDAR surveys produce point clouds, but not every point cloud came from LiDAR.
How do I convert a point cloud into a 3D model?
That is a different job from the one described here. A 3D model normally means surfaces or solids, which is the scan to BIM workflow associated with terrestrial scanning. Aerial LiDAR conversion produces a survey drawing: contours, spot heights, footprints and feature lines, with elevation carried as geometry or as attributes.
What does a point cloud to CAD conversion cost?
Manual conversion is usually priced by area or by hour and varies widely with how much detail the drawing needs. Automated conversion is normally priced by area processed. The honest answer is that it depends on how many layers you need and how much manual correction the classification requires, so compare quotes on the same layer list.
Should I deliver DXF or DWG?
DXF is an open interchange format that every CAD application reads, which makes it the safer default when you do not control what the recipient uses. DWG is AutoCAD's native format and is preferable when you know the recipient works in AutoCAD and wants to continue in it. If in doubt, ask, and if you cannot ask, send DXF.
How long does the conversion take?
The automated steps run in minutes to hours depending on the size of the survey and how many layers you request. The variable part is the manual classification check, which depends entirely on how clean the automatic result is on your particular site. Wooded and dense urban sites need more attention than open ground.
Related resources
LiDAR topography
DTM, contours, hillshade and the survey workflow around them.
Read the guidePoint cloud vectorization
Every vector deliverable Lidarvisor extracts, in detail.
See the layersLiDAR classification codes
The ASPRS LAS class numbers and what each one means.
Browse the codesContour lines guide
How contours are generated and how to choose an interval.
Read the guideDigital terrain models
What a DTM is, how it is built and where it is used.
Read the guideLiDAR processing software
How the available tools compare for this kind of work.
Compare toolsTurn your point cloud into a CAD drawing
Upload a LAS or LAZ file and get contours, footprints and feature lines as DXF.
Create free account50 hectares free. No credit card. No software to install.