
01
Export your marks
Whatever your rover or total station writes out. One row per point, with a name, coordinates and an elevation.
Features
Point Cloud Viewer Point Cloud Preprocessing Point Cloud Classification Point Cloud Rasterization Point Cloud Vectorization Processing APIIndustry
Land Surveying Utility Vegetation Management Forestry Hydrology & WaterMore
Pricing ContactGuide
Upload the points you measured on the ground, see how far your cloud sits from them before you process anything, correct it if correcting helps, and hand your client an accuracy statement their own surveyor will recognize.
Checking is free on every plan • a correction adds no extra charge
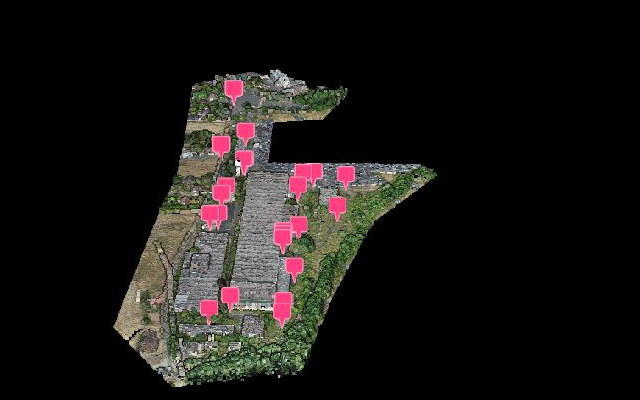
The whole flow
Six moments. Only one of them is a decision, and you make it with the error already on screen.
Whatever your rover or total station writes out. One row per point, with a name, coordinates and an elevation.
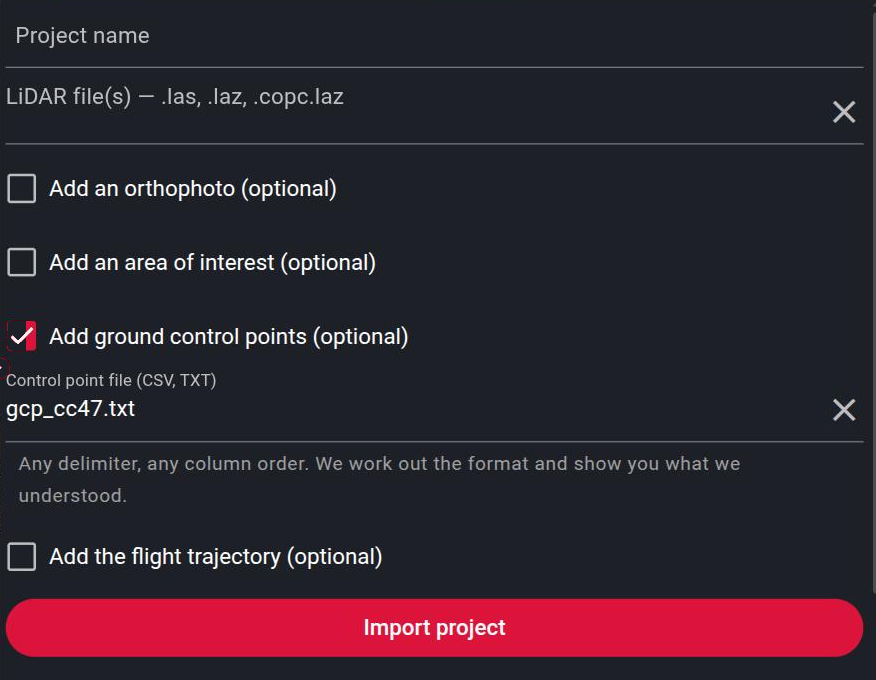
In the Create a project panel, tick Add ground control points and pick the file. The point cloud itself is not modified by the import.
Lidarvisor states how many points it read and which column it took as ID, X, Y and Z, so a wrong axis order never rides silently into a figure.
It runs on its own shortly after your upload finishes, against the raw cloud, before any processing has happened.
Four options, each showing the accuracy it would leave you and what it would do to your data. The default changes nothing inside your cloud.
After processing, the figure is measured again against classified ground and written into the project report.
Walkthrough
The four places you will actually spend time.
Importing
No reformatting, no template to fill in.
The importer handles what survey software actually writes. Names help when they are there, but the deciding test is your point cloud itself: a candidate reading either drops the points inside the cloud footprint or it does not. That one test catches transposed axes, a wrong coordinate system and wrong units at the same time.
The preliminary check
The point of checking early is that it is still a choice.
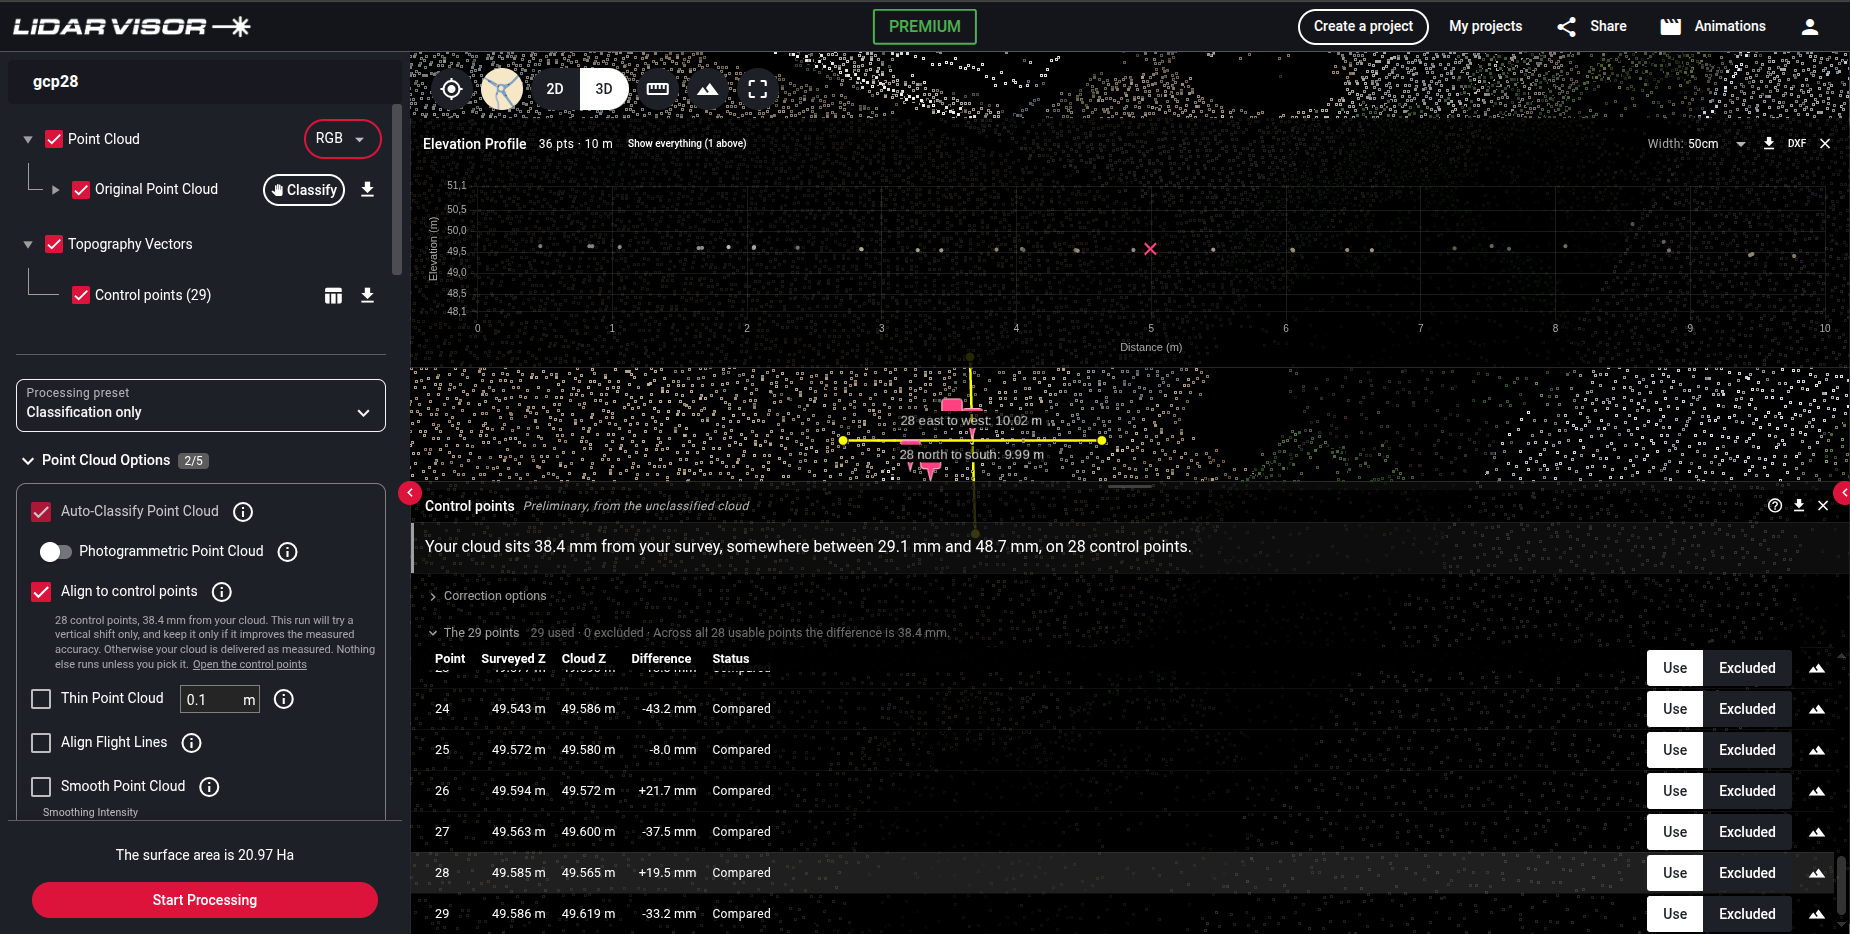
No classification exists yet at that moment, so the ground around each mark is estimated from the raw cloud and read at the exact position of your point. By the time you reach the processing options, Align to control points is already ticked and already tells you what it is working with: how many points, how far the cloud sits from them, and exactly what the run will try. This early figure is always labelled as preliminary, and the figure measured after processing is labelled separately. They differ by centimetres and are never presented as the same number.
The panel
It docks along the bottom, so the map stays visible.
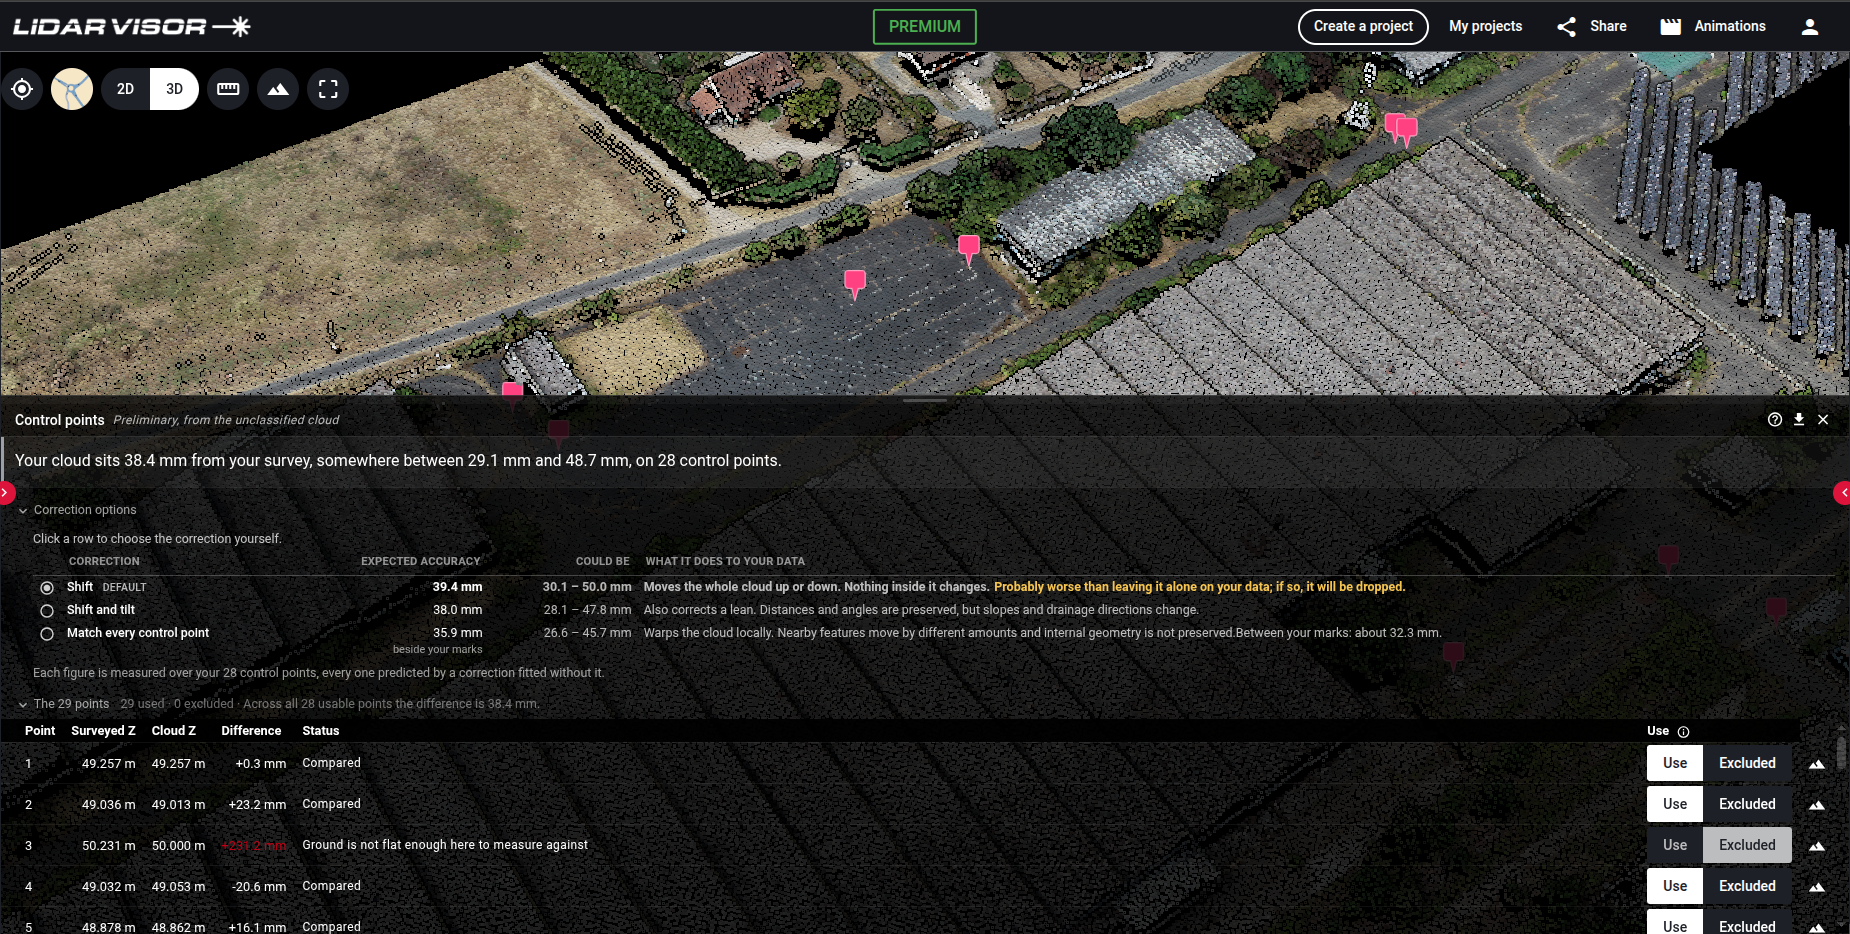
The panel leads with how far your cloud sits from your survey, the range that figure can be known to, and how many points it rests on. The figure is measured honestly: every point is predicted by a correction computed without it, so no point ever marks its own homework. Open Correction options and each rung is priced the same way, including the one that says outright it would probably leave your data worse. Underneath, one row per control point gives you the surveyed elevation, the cloud elevation, the difference and the status, and every column sorts.
Verify it yourself
You should not have to take a number on trust.
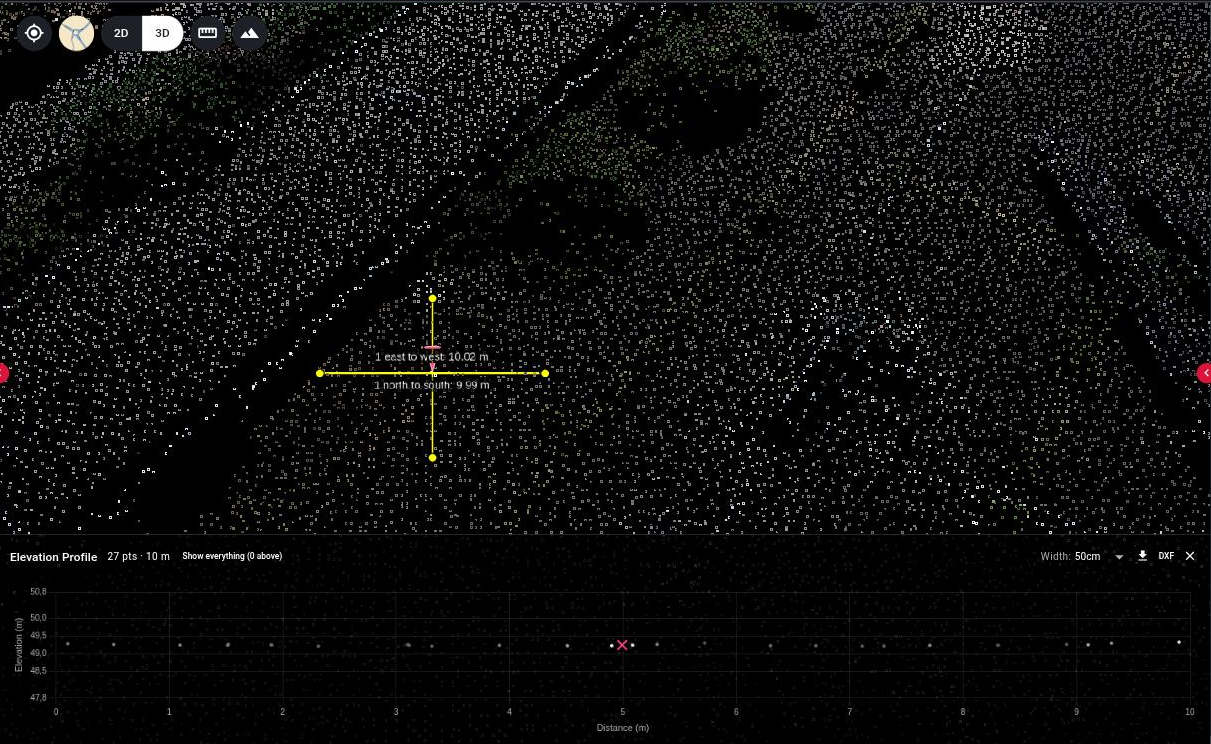
The table says a point is out by some amount, or that the ground there could not be measured. Click the ground icon on any row and Lidarvisor cuts two cross sections straight through that mark, one north to south and one east to west, using the same profile tool you use everywhere else. Your surveyed point is drawn on the section at its surveyed elevation, so you can see whether it sits above the ground, below it, or on a kerb the estimator refused.
Honest exclusions
A point that cannot be measured fairly is excluded on its own, with its reason in the status column. It never fails the whole set, and the report lists every exclusion.
The mark falls outside the point cloud, or outside the area you asked to process.
Not enough ground around the mark to measure against. Common under dense canopy.
The surface there is too uneven to give a reading you could rely on.
A break in the surface, such as a curb, step or bank, would bias any elevation read at that spot.
The cloud is well above your mark: probably a roof, a vehicle or canopy rather than ground.
A mark the other marks rule out. A target that moved, or a transcription error. Shown, and kept out of every figure.
The decision
Expand Correction options in the panel to see them measured against your own survey.
| Option | What it does to your data | When it fits |
|---|---|---|
| Leave it alone | Your cloud is delivered exactly as it was measured. | The differences are already small, or their shape says no correction is the right fix. |
| Shift Default | Moves the whole cloud up or down. Nothing inside it changes. | A common offset across the site. Needs at least three usable points. |
| Shift and tilt | Also corrects a lean. Distances and angles are preserved, but slopes and drainage directions change. | The differences grow across the site. Needs at least five usable points. |
| Match every control point | Warps the cloud locally. Nearby features move by different amounts and internal geometry is not preserved. | Local distortion the other options cannot reach. Needs at least seven usable points. |
Every row carries its expected accuracy and a 95% range, measured the same held-out way as the headline. An option that would probably leave your cloud worse than doing nothing says so on its own row, and options your number of points cannot support are greyed out with the reason.
When you press Process
Align to control points sits with the other processing options, and comes pre-ticked when your project has control points. Two things then decide everything: that checkbox, and the correction selected in the panel.
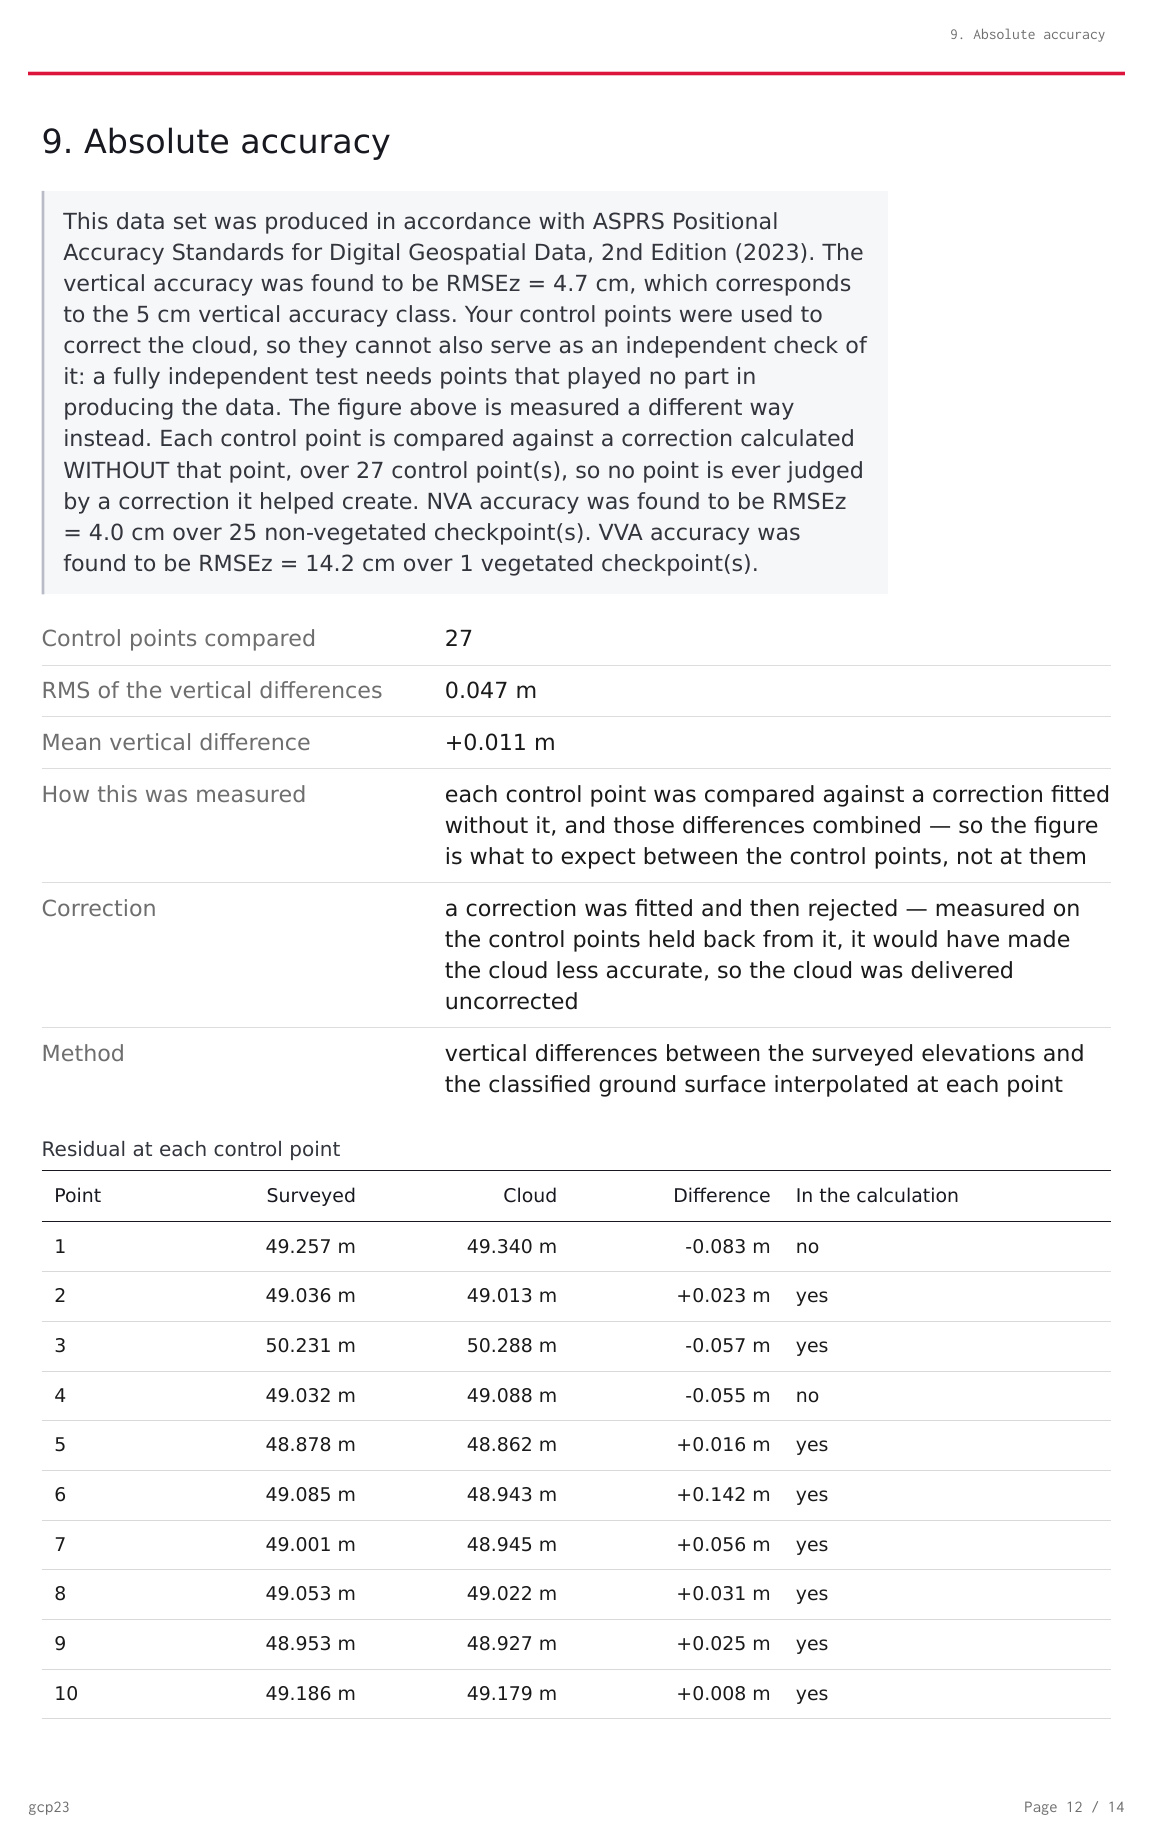
The one rule: no correction ever ships that measures worse than doing nothing. Before your cloud is touched, the chosen correction is measured again on classified ground, each point predicted by a fit that did not use it. If it fails that test, even when you picked it explicitly, it is dropped, the cloud is delivered uncorrected, and the report says a correction was fitted and rejected. On a scattered survey that is the honest outcome, and ticking the option correctly does nothing.
The correction is applied inside the processing pipeline, before anything is derived from the cloud, so your terrain models, contours, breaklines, vectors, tiles and reports all come from the corrected cloud natively. There is no second cloud to reconcile and no re-tiling. Your raw uploaded file is never modified, and the decision is taken once, before the run.
A large offset is tested for you. When the cloud and your points disagree by half a metre or more on average, that is usually a vertical datum mismatch rather than a data problem. Lidarvisor tests the usual suspects against the measured offset: the geoid separation, an ellipsoid and datum realisation mix, two geoid models, US survey feet against international feet, and a forgotten antenna height. If one of them explains it, the panel names it with the predicted and the observed figures, so you fix the cause instead of baking it in. If none does and the offset is a steady one of up to 10 m, you are offered a one time height shift to match your points, applied only if you consent to it.
The deliverable
Project report
Written the way a reviewing surveyor expects to read it.
When control points could be compared, the report gains an Absolute accuracy section following the ASPRS Positional Accuracy Standards for Digital Geospatial Data, 2nd Edition. It reports the measured vertical accuracy, names the number of checkpoints, and where the classification allows it reports non-vegetated and vegetated terrain separately. When there are no control points the section is simply absent, never a placeholder and never an invented value.
Questions
No. Importing them and checking against them is free, on every plan, and your own survey data is never treated as a paid deliverable. A correction adds nothing either: it runs inside your normal processing run, which is billed on area whichever options you tick.
One delimited text file: CSV, TXT, ASC or PTS. Instrument-native binary formats such as Leica GSI or Trimble JOB are not read. Every instrument can export delimited text, so export that instead.
No. Lidarvisor tries the system of your project, then the system the file declares, then longitude and latitude in WGS 84, and reprojects the points. A coordinate system written on the first comment line of the export, as several packages do, is read, and Emlid Flow exports are recognised. When nothing places the points on your cloud, you are asked which system the file is in, and the message says how far off and in which direction the points land rather than giving a generic parse error.
They are tested, never transformed silently. Lidarvisor does not apply geoid corrections behind your back. When the average offset reaches half a metre, it checks whether a known datum confusion explains it, such as a geoid separation, two geoid models, a datum realisation mix, US against international feet or an antenna height, and names the one that matches with its figures. If none matches and the offset is steady and no more than 10 m, you can consent to a single height shift; the report then describes it as a shift to your points, never as a certified accuracy. When nothing can be tested, the check still measures the spread of the differences but refuses to call a common offset an error, and the report says so.
A vertical shift needs at least three usable points, the shift and tilt five, and the local warp seven. Every option is tested on points it was not fitted to, and that test needs points to spare, so a shift computed from one or two points is shown but never applied. Options your survey cannot support are greyed out with the reason rather than offered and then failing.
The decision is made once, before you press Process. Control points freeze once the project has been processed, whether or not a correction was applied. The panel then shows the outcome, the reason for it and the measured result, and the toggles lock.
Go deeper
The reference documentation covers every status, column and figure. The article covers the standards themselves.
Upload your cloud with the points you measured on the ground, and see how far apart they are before you decide anything.
Create free accountThe accuracy check is free on every plan. Questions? Contact our team or see pricing