
Learn LiDAR
LiDAR Volume Calculation for Stockpile Surveys
Stockpile Surveys, Cut/Fill Analysis & Volume Maps
No credit card required • 50 hectares included
Need a stockpile survey without weeks of back-and-forth? LiDAR volume calculation turns classified point clouds into repeatable stockpile, cut/fill, and terrain-change measurements.
Teams use it to build volume maps, compare survey dates, and track cubic meters across mining, aggregates, and construction workflows.
How LiDAR Enables Volume Calculation
Volume calculation requires two things: an accurate reference surface and an accurate current surface. LiDAR provides both through its ability to capture millions of elevation points per second from aerial platforms.
The core workflow involves three stages:
- Point cloud classification: separating ground points from vegetation, buildings, and other objects
- Surface generation: creating a DTM (bare earth) and/or DSM (top surface including objects) from the classified points
- Volume computation: calculating the difference between two surfaces or between a surface and a reference plane
The accuracy of the final volume depends directly on the quality of the classification and surface models. Errors in ground point classification cascade into DTM errors, which produce incorrect volume figures.
Volume Calculation Methods
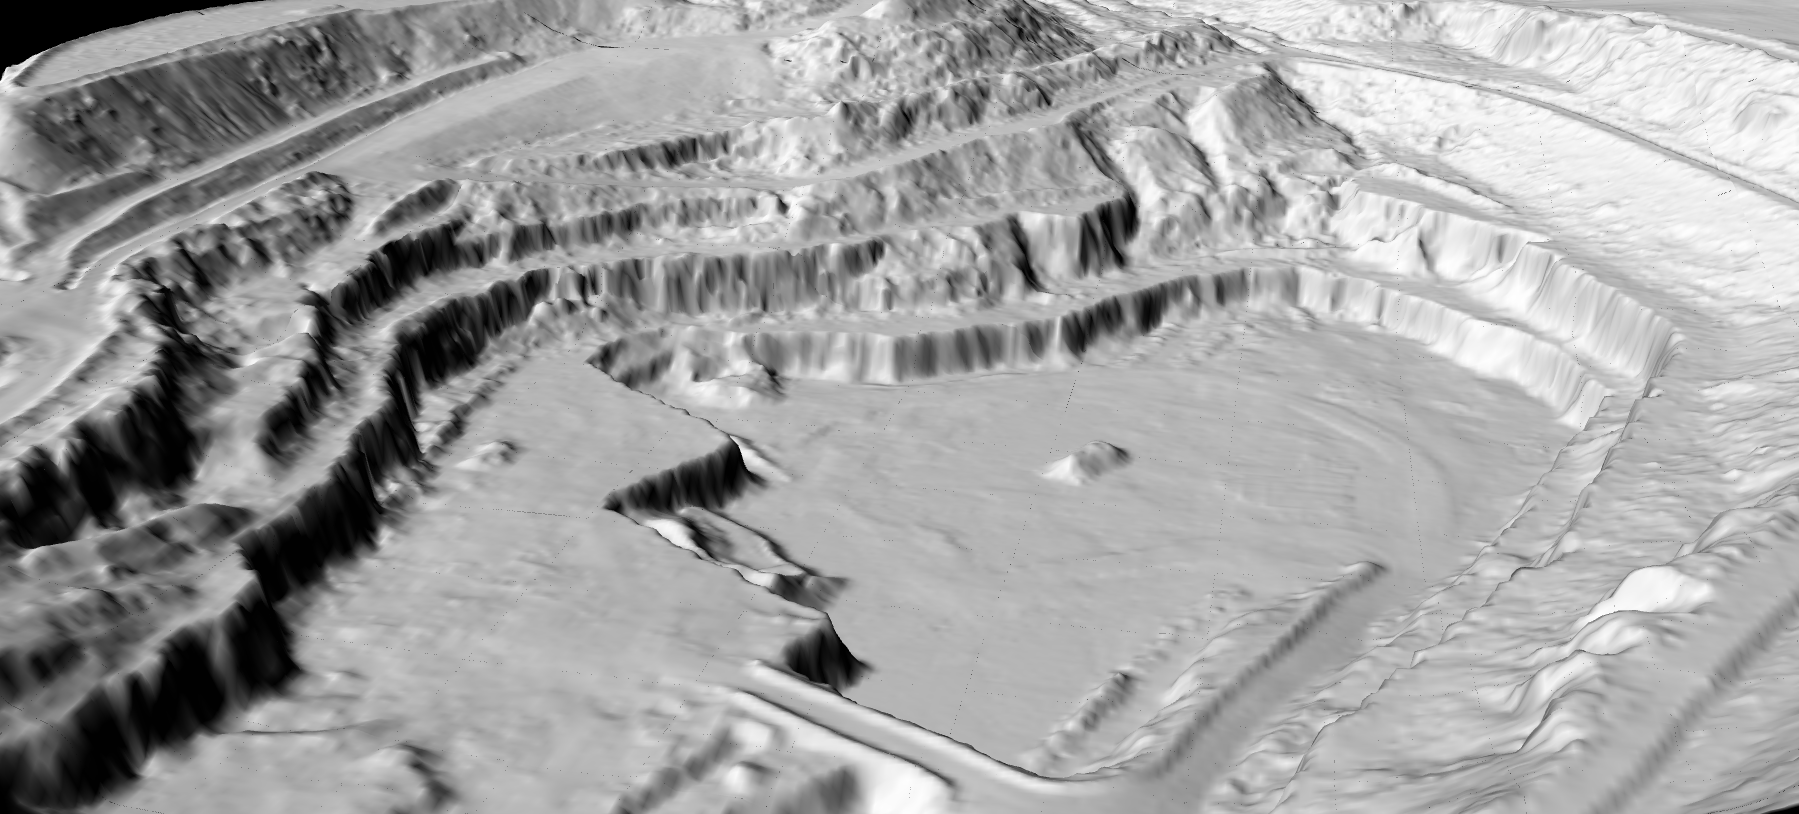
There are three primary methods for calculating volumes from LiDAR-derived surfaces. Each serves a different use case.
1. Surface-to-Plane
Stockpile Volume
Measures the volume between a surface model and a flat reference plane. The standard approach for stockpile measurement.
How it works:
- Generate a DSM from the LiDAR point cloud
- Define a reference plane at the stockpile base
- Calculate the volume between them
Accuracy: ±2-5% with drone LiDAR at 50+ points/m²
Industries: Mining, aggregate yards, grain storage, landfill management
2. Surface-to-Surface
Cut and Fill
Compares two surface models to determine where material has been added (fill) or removed (cut). The primary method for earthworks management.
How it works:
- Generate a DTM from the “before” survey
- Generate a DTM from the “after” survey
- Subtract: positive = fill, negative = cut
Key advantage: Centimeter resolution vs. spot measurements
Industries: Road construction, site grading, dam building, dredging
3. Multi-Temporal
Change Detection
Compares surface models from different dates to quantify terrain changes over time.
Applications:
- Mining progress: monthly extraction volumes
- Erosion monitoring: soil or cliff face loss
- Landfill capacity: remaining airspace calculations
- Construction progress: earthwork quantities vs. design
Step-by-Step: Point Cloud to Volume
Need clean DTM and DSM for your volume calculations? Lidarvisor handles the classification and surface generation automatically
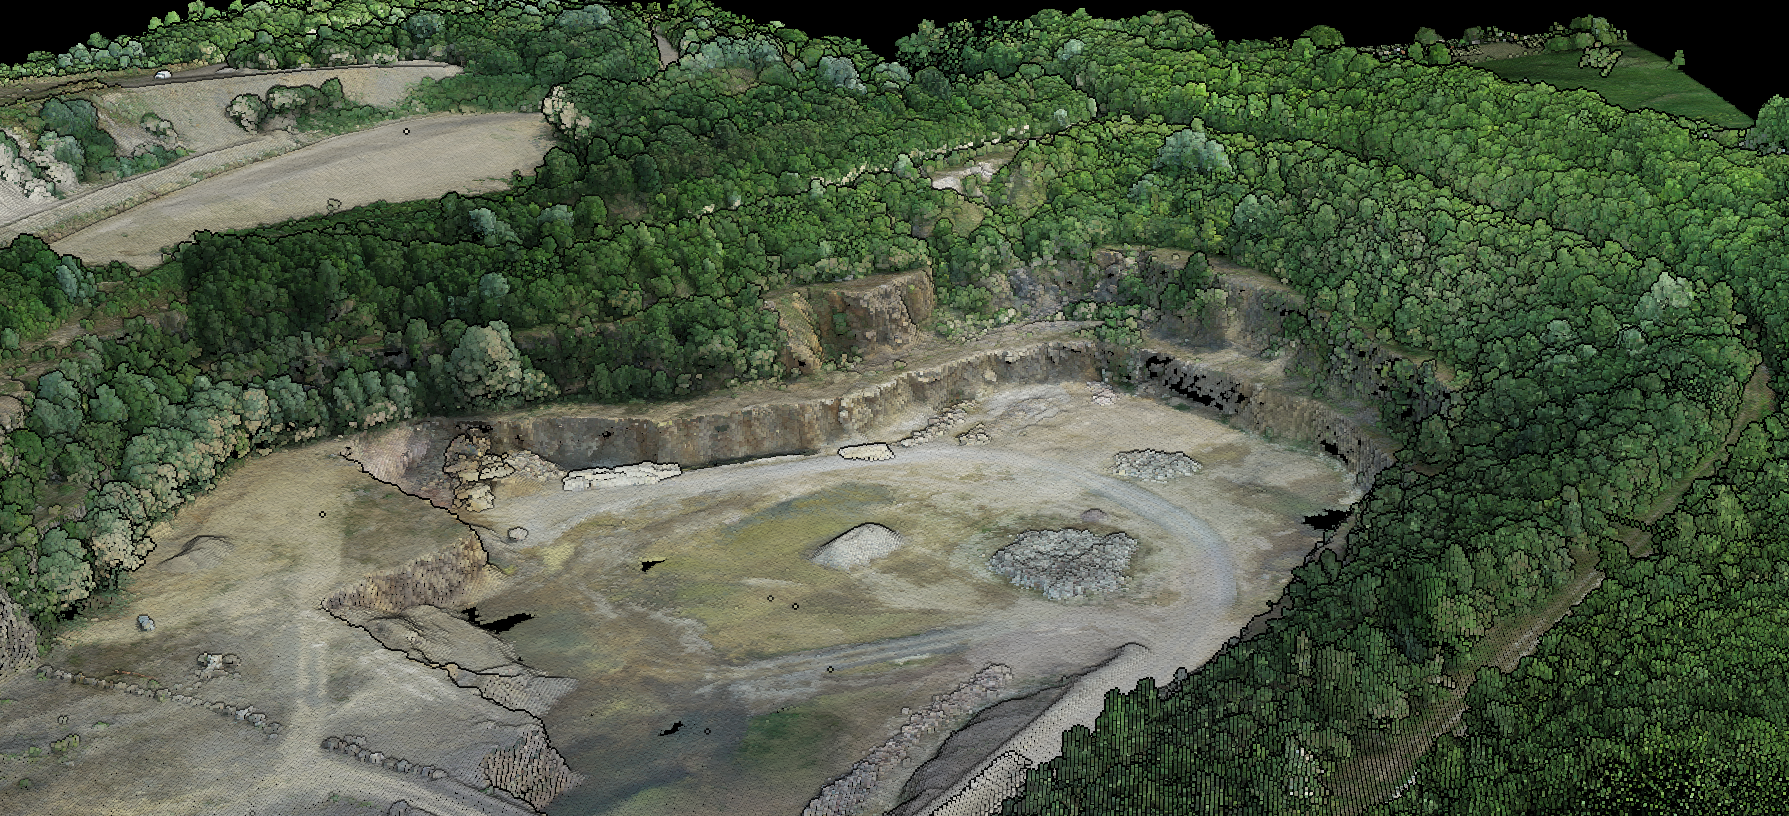
Capture LiDAR Data
Fly the survey area with drone or aircraft LiDAR. Aim for 50+ pts/m² for stockpiles, 10+ pts/m² for large-area earthworks, with 30% swath overlap.
Classify the Point Cloud
Separate ground points from vegetation, vehicles, and structures. AI-powered tools like Lidarvisor automate this step, classifying points into 12+ standard classes.
Generate Surface Models
Create a DTM from ground points (bare earth) and DSM from all first-return points (includes stockpiles). Export as GeoTIFF at 0.1–1.0m cell size.
Calculate Volumes
Use GIS or surveying software to compute volumes. For each grid cell, multiply the height difference between surfaces by the cell area and sum all cells.
Why LiDAR stockpile measurement fails when the base surface is wrong
Most stockpile measurement errors do not start in the volume tool. They start earlier, when vegetation, haul-road edges, or parked equipment leak into the surface model used as the pile base.
For repeatable LiDAR stockpile measurement, teams usually need three checks before they trust the number:
- Ground points are actually clean: trucks, berms, and low vegetation should not be treated as the reference surface.
- The pile edge is obvious: if the toe of the stockpile blends into the surrounding yard, the reference plane or comparison surface gets noisy fast.
- The output matches the downstream handoff: survey, quarry, and construction teams often need both the volume result and the supporting DTM or DSM for QA.
That is why upstream classification still matters even when the real business question is simply, “How much material is here today?”
DTM vs DSM: Which Surface?
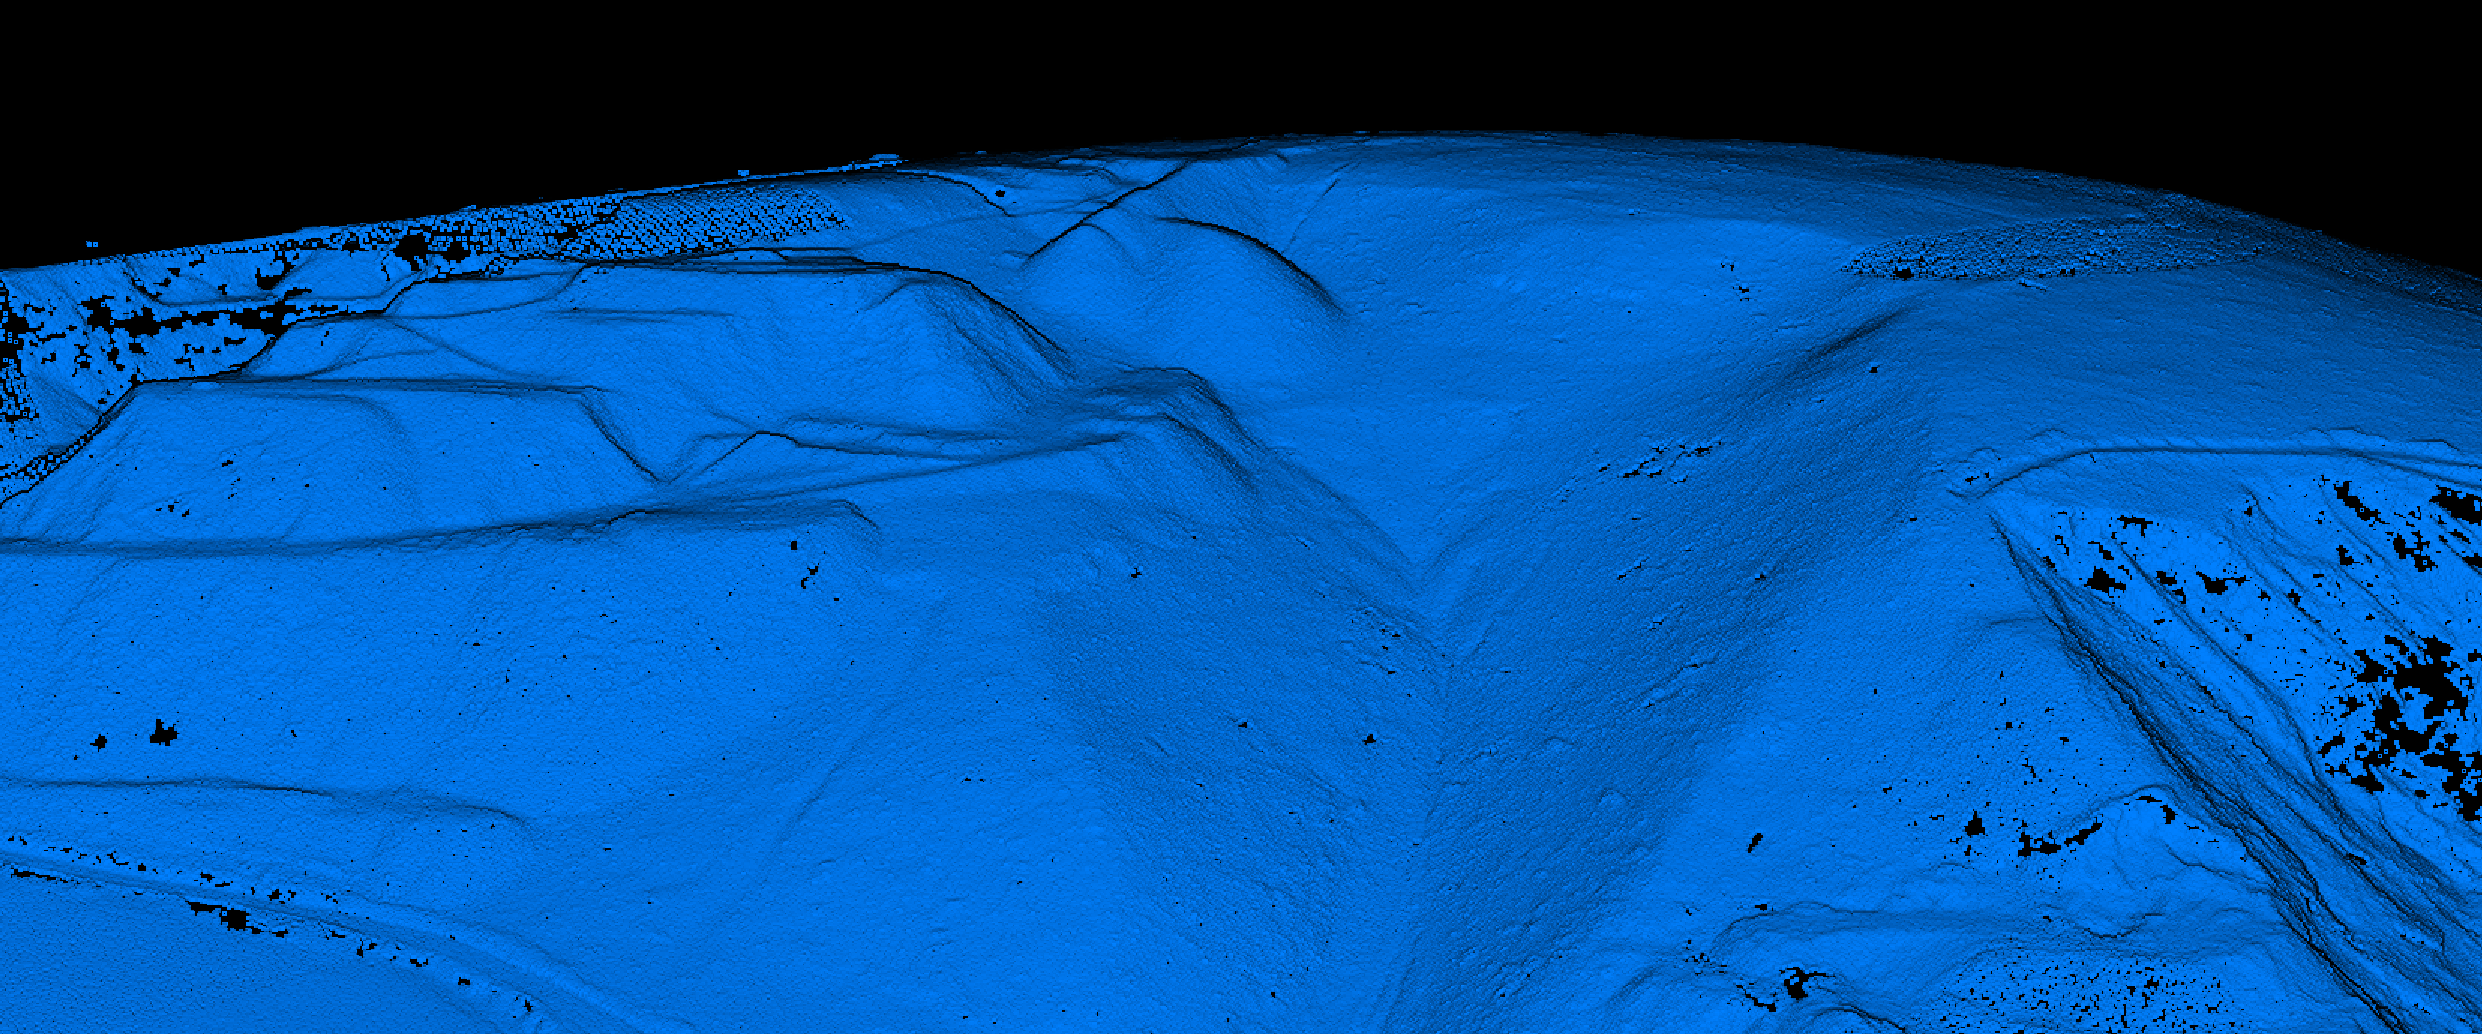
Choosing the correct surface model is critical:
- Use DTM for earthworks cut/fill: bare earth surface excluding temporary objects
- Use DSM for stockpile volume: stockpiles are above-ground objects the DSM captures correctly
- Use both for comprehensive analysis: comparing DSM against DTM gives the most complete picture
Many professionals use a combination: the DTM as the base reference surface and the DSM as the measurement surface. The difference at any point represents the height of above-ground material.
Industry Applications
LiDAR volume calculation serves critical functions across multiple sectors
Mining & Quarrying
Stockpile inventory, pit volume tracking, blast planning, and regulatory compliance. Drone LiDAR replaces dangerous manual GPS walks on loose material.
Construction Earthworks
Verify contractor claims, track grading progress, optimize material movement, and confirm final as-built surfaces against design specs.
Landfill Management
Calculate remaining airspace for capacity planning. Compare current surfaces to permitted fill boundaries and forecast closure dates.
Accuracy Considerations
Volume accuracy depends on several factors in the LiDAR processing chain
| Factor | Impact on Volume Accuracy | How to Mitigate |
|---|---|---|
| Point density | Low density misses surface details on irregular stockpiles | Fly at 50+ pts/m² for stockpiles |
| Classification errors | Vegetation or vehicles misclassified as ground inflates DTM | Use AI classification with vehicle removal |
| Georeferencing | Positional offsets create false volume changes | Use consistent GCP network across surveys |
| DTM resolution | Coarse cell size smooths terrain features and edges | Use 0.1–0.25m cell size for stockpiles |
| Edge delineation | Poor boundaries affect base plane estimation | Capture toe-of-slope clearly in flight planning |
The most common source of error is poor point cloud classification. When vegetation is not properly separated from ground, the DTM includes vegetation height, inflating the apparent terrain elevation.
Similarly, vehicles and equipment left on stockpiles during the survey appear as part of the surface, adding false volume.
Lidarvisor’s AI classification addresses both issues by automatically identifying and separating vegetation (low, medium, and high), vehicles, and equipment from ground points, producing clean surface models ready for volume analysis.
Software Comparison for Volume Calculation
Once you have your DTM and DSM exported from Lidarvisor as GeoTIFF files, several software packages can perform the volume computation
| Software | License | Best For | Volume Tools |
|---|---|---|---|
| QGIS | Free / Open Source | GIS professionals, budget teams | Raster Calculator, Zonal Statistics, Volume tool |
| ArcGIS Pro | Commercial | Enterprise GIS workflows | Cut Fill, Surface Volume, 3D Analyst |
| Civil 3D | Commercial | Civil engineering, road design | TIN Volumes, Grading, Quantity Takeoff |
| Global Mapper | Commercial | General-purpose surveying | Pile Volume, Cut and Fill, Flatten/Fill |
| CloudCompare | Free / Open Source | Point cloud comparison | Cloud-to-Cloud distance, Volume tool |
Streamline with Automated Classification
The bottleneck in most LiDAR volume calculation projects is not the volume computation itself, which is mathematically straightforward. It is the point cloud classification step that precedes surface model generation.
Traditional Approach
Specialized software, extensive parameter tuning, and hours of manual review. For recurring surveys like monthly stockpile inventories, this overhead makes LiDAR-based volumes impractical.
Streamlined with Lidarvisor
Upload your LAS/LAZ file and receive automatic classification into 12+ classes, DTM and DSM generation, and GeoTIFF export. Minutes, not hours. Monthly or weekly surveys become practical.
Key Takeaways
- Surface models are the foundation: LiDAR volume calculation relies on accurate DTM and DSM generated from classified point clouds
- Three primary methods: surface-to-plane (stockpiles), surface-to-surface (cut/fill), and multi-temporal comparison (change detection)
- Classification quality matters most: separating vegetation and vehicles from ground is the single biggest accuracy factor
- Automation removes the bottleneck: AI classification makes frequent volume surveys practical
- Use your preferred tools downstream: export DTM/DSM as GeoTIFF for volume computation in any GIS or CAD software
Frequently Asked Questions
What accuracy can I expect from LiDAR volume calculations?
With drone LiDAR at 50+ points/m² and proper classification, stockpile volume accuracy is typically ±2-5%. The main accuracy factors are point density, classification quality (especially vehicle and vegetation removal), georeferencing consistency, and DTM cell size resolution.
Should I use DTM or DSM for volume calculation?
How often should I run volume surveys?
Monthly surveys are standard for mining stockpile inventory and construction progress tracking. Weekly surveys are practical with automated classification tools and are increasingly common for active construction sites and high-value stockpile operations.
What software can I use for volume calculation from LiDAR?
After generating DTM/DSM rasters, you can compute volumes in QGIS (free), ArcGIS Pro, Civil 3D, Global Mapper, or CloudCompare (free). Each has dedicated volume calculation tools for surface-to-plane and surface-to-surface analysis.
Does Lidarvisor calculate volumes directly?
Lidarvisor handles the critical first steps: point cloud classification, DTM generation, and DSM generation. These surface models are exported as GeoTIFF files, which you then import into your preferred GIS or CAD software for volume computation.
Ready to Calculate Volumes?
Start with 50 Hectares of free processing. Generate classified point clouds, DTM, DSM, and more — all ready for volume calculation in your downstream software.
Create free account50 hectares free. No credit card. No software to install.