Render massive LiDAR datasets for review, QA, and client delivery
What is Point Cloud Rendering?
Point cloud rendering is the process of displaying 3D point data on a 2D screen while preserving enough detail for interpretation. A typical LiDAR scan contains millions to billions of points with XYZ coordinates plus attributes such as intensity, RGB color, return number, and classification.
The challenge is scale. A single aerial or drone LiDAR survey can produce hundreds of gigabytes of data. Rendering that data in real time requires techniques such as octree indexing, Level of Detail streaming, and GPU-accelerated shaders so teams can inspect terrain, vegetation, buildings, and powerline corridors without waiting on heavyweight desktop workflows.
Color Modes for Point Cloud Visualization
Different rendering modes highlight different aspects of your data. Choosing the right mode depends on your analysis goals.
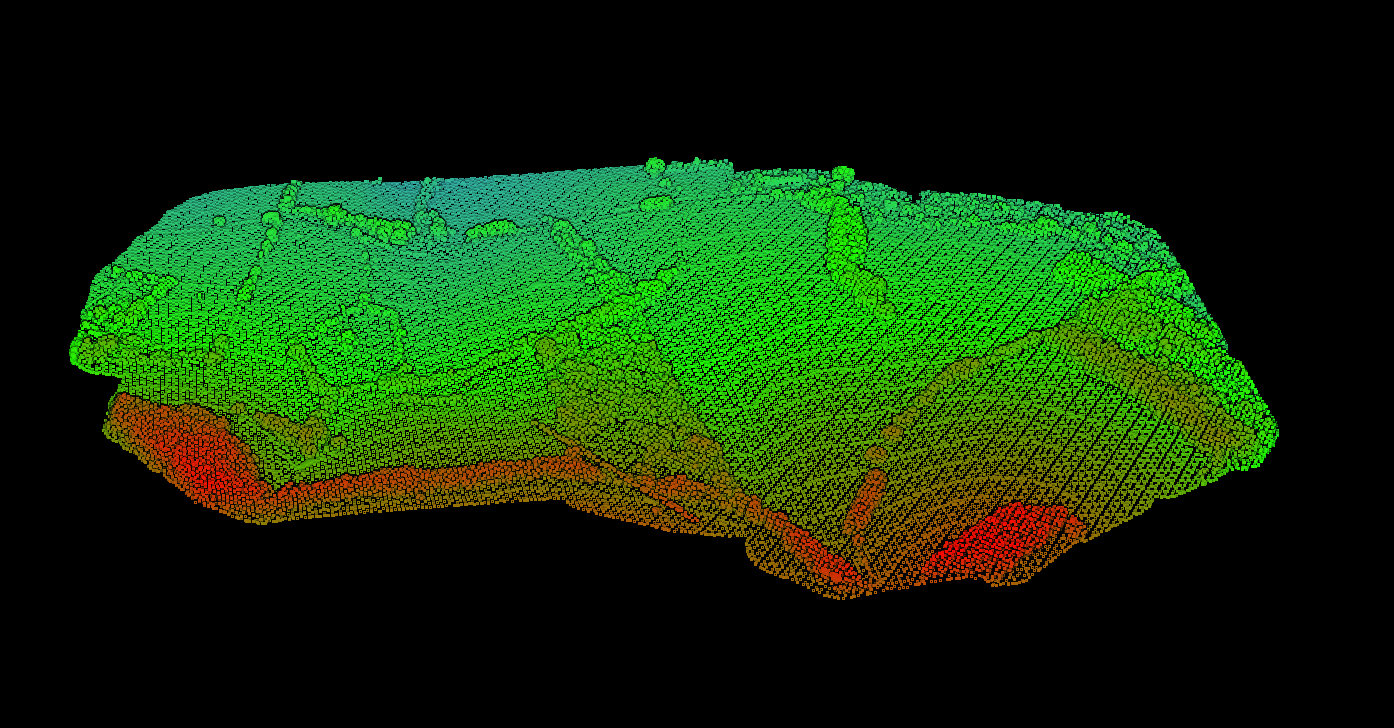
Elevation-colored point cloud showing terrain variation
Level of Detail (LOD) Rendering
Large point clouds cannot be rendered at full resolution in real-time. Level of Detail systems dynamically adjust point density based on camera distance and view angle.
Modern LOD implementations use hierarchical data structures like octrees. The point cloud is divided into nested cubes, with each level containing a subset of points. The renderer loads only the cubes visible in the current view.
This approach enables rendering of billion-point datasets in web browsers—something that was impossible just a few years ago.
Web-Based Point Cloud Rendering
Browser-based point cloud viewers have transformed how teams share and review 3D data. Using WebGL and streaming tile formats, these viewers can display massive datasets without requiring desktop software.
Key advantages of web-based rendering:
- Accessibility: Anyone with a link can view the data
- No installation: Works in standard browsers
- Streaming: Only loads visible data, not the entire file
- Collaboration: Multiple users can view simultaneously
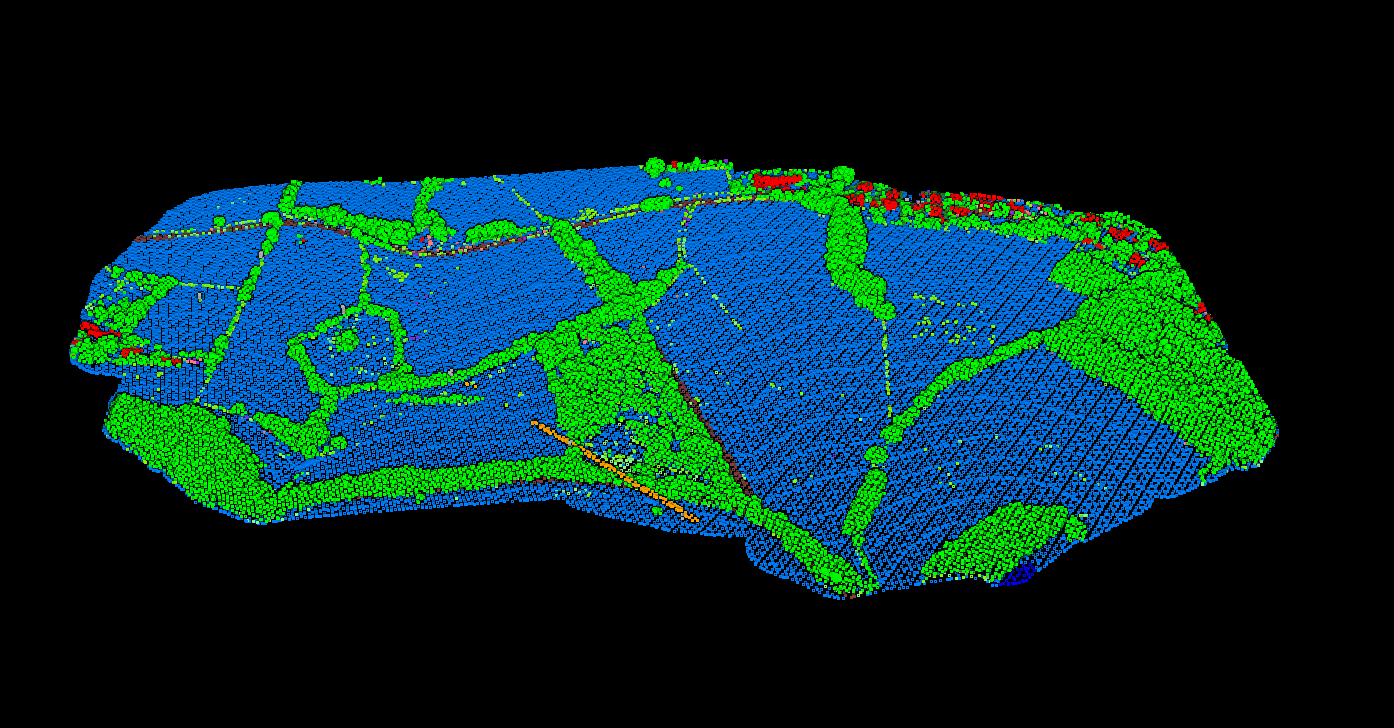
Classification-colored point cloud in web viewer
Lidarvisor Handles It Automatically
For web rendering to work efficiently, point clouds must be converted to streaming-optimized formats. This preprocessing step builds the LOD hierarchy and tile structure needed for on-demand loading.
Lidarvisor provides automatic cloud-based processing that handles this conversion for you. Upload your LAS/LAZ files, and within minutes you get a web-ready point cloud with built-in classification, elevation coloring, and shareable viewer links.
Point Size and Splat Rendering
Each point in a cloud is rendered as a small shape on screen, typically a circle or square. Point size significantly affects visual quality:
- Too small: Gaps appear between points, revealing the discrete nature of the data
- Too large: Points overlap, obscuring detail and creating a bloated appearance
- Adaptive sizing: Point size adjusts based on local density and camera distance
Advanced renderers use splat-based techniques where points are rendered as oriented disks that blend together, creating a more continuous surface appearance.
Filtering and Class Visibility
Effective rendering includes the ability to filter what is displayed.
Overlay and Cross-Section Tools
Beyond basic rendering, useful visualization tools include:
01
DTM/Hillshade Overlay
Render derived terrain surfaces alongside the point cloud for context.
02
Cross-Section Tool
Cut through the data to see vertical profiles and internal structure.
03
Measurement Tools
Calculate distances and areas directly on the rendered view.
04
Annotation Layers
Add notes and markers for team communication and documentation.
Choosing the Right Rendering Approach
Your rendering choice depends on your workflow:
| Goal | Recommended Approach |
|---|---|
| Quick data review | Web-based viewer with elevation coloring |
| Classification QC | Class-based colors with filtering |
| Client presentation | RGB rendering, shareable links |
| Terrain analysis | Elevation mode with hillshade overlay |
| Feature extraction | Classification mode with class isolation |
Frequently Asked Questions
The best color mode depends on your goal. Elevation coloring is ideal for terrain analysis, classification colors help with QC and land cover assessment, intensity reveals material differences, and RGB provides photorealistic visualization for presentations.
LOD systems dynamically adjust point density based on camera distance. Points far from the camera are decimated while nearby points are rendered at full detail. This uses hierarchical data structures like octrees to enable real-time rendering of billion-point datasets.
Yes, modern web-based viewers using WebGL and streaming tile formats can display massive datasets without desktop software. The point cloud must be converted to a streaming-optimized format first, which Lidarvisor handles automatically.
Key factors include total point count, LOD implementation quality, point size settings, GPU capabilities, and data format optimization. Streaming tile formats and octree structures significantly improve performance for large datasets.