How Terrain Data Transforms Flood Risk Assessment
The Problem with Current Flood Risk Data
FEMA Flood Insurance Rate Maps (FIRMs) form the foundation of most flood underwriting decisions, but they have significant limitations that lead to mispriced policies, unexpected claims, and inadequate reserves.
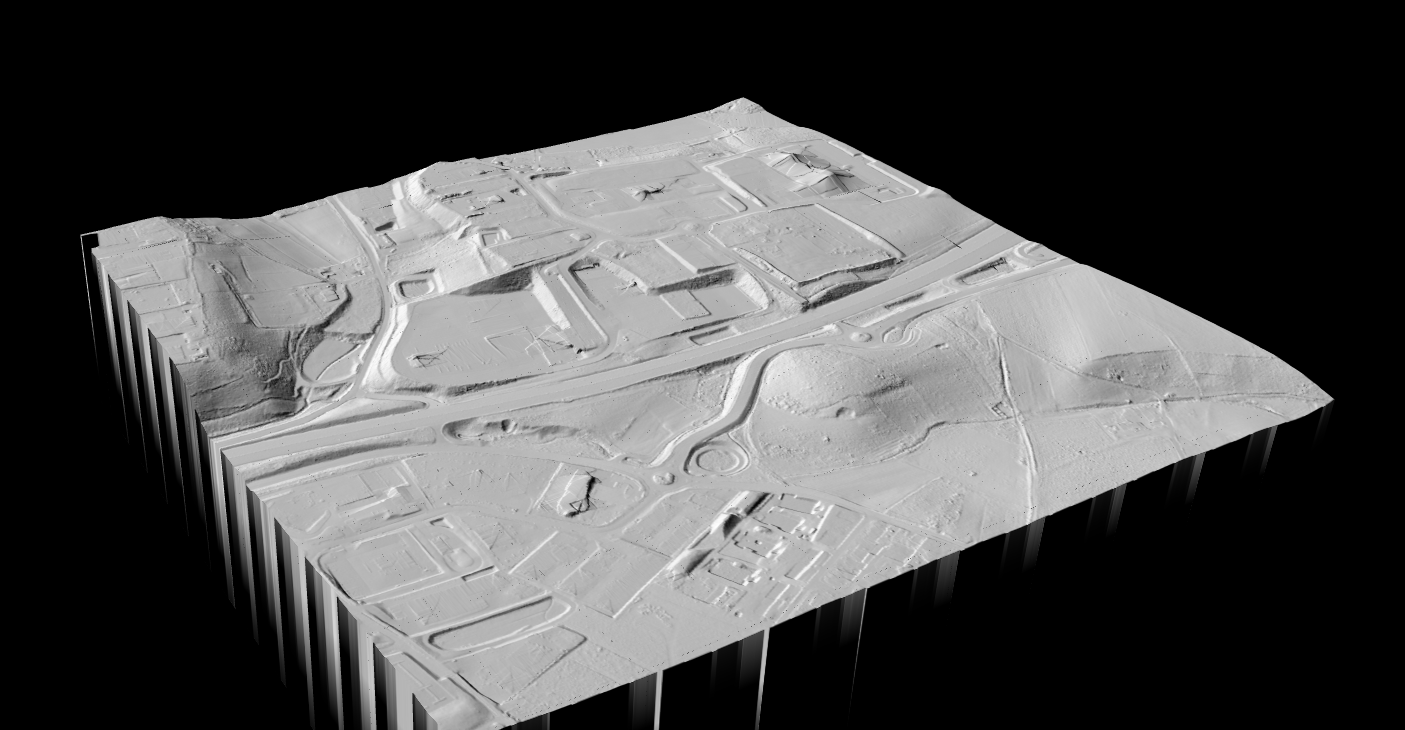
DTM hillshade showing urban area with river for flood risk analysis
How LiDAR Improves Flood Risk Assessment
LiDAR captures terrain elevation at centimeter-level accuracy with 8+ points per square meter. When processed into Digital Terrain Models, this data reveals flood risk factors invisible to traditional methods:
- Property-level elevation: exact building elevation relative to water bodies and base flood elevation
- Drainage patterns: how water flows across the landscape, revealing hidden flood paths
- Natural barriers: berms, ridges, and features that reduce actual flood exposure
- Portfolio exposure: batch elevation extraction for thousands of properties
LiDAR Deliverables for Insurance
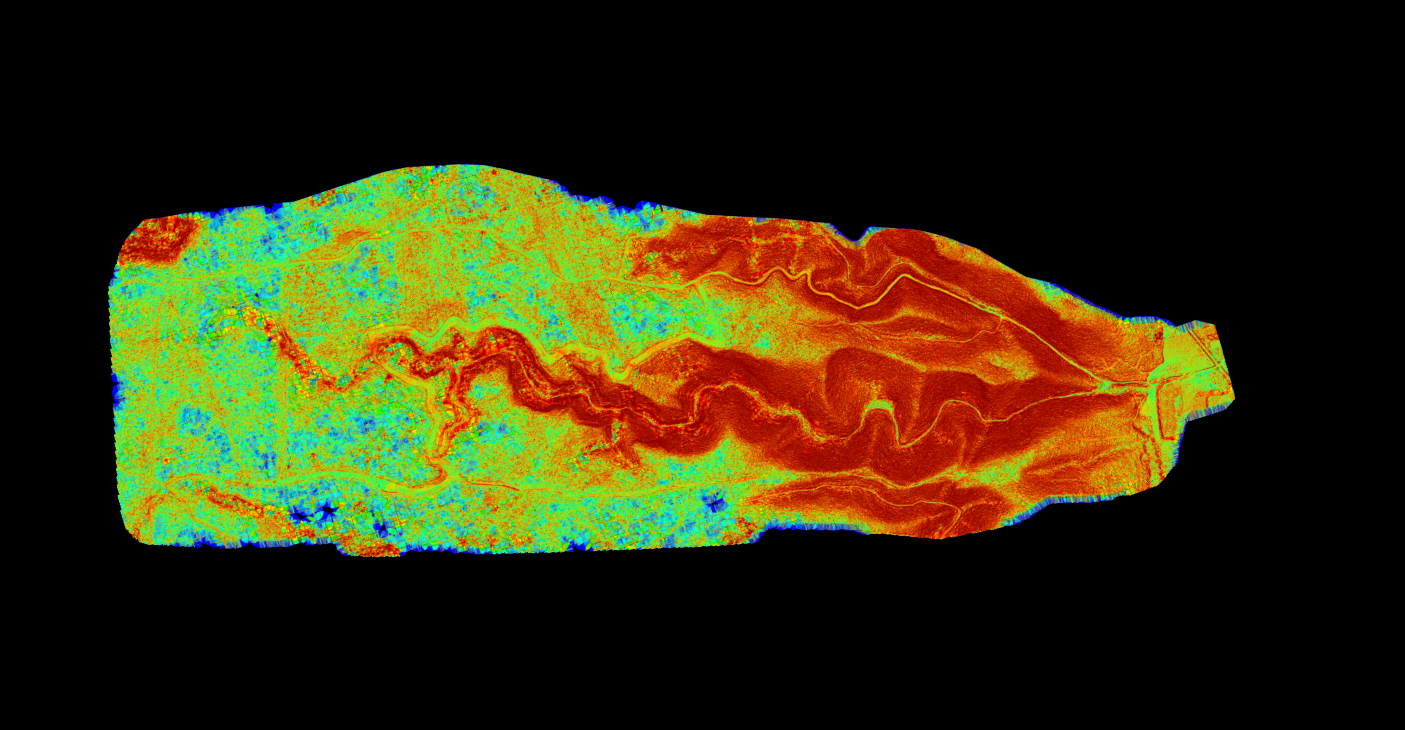
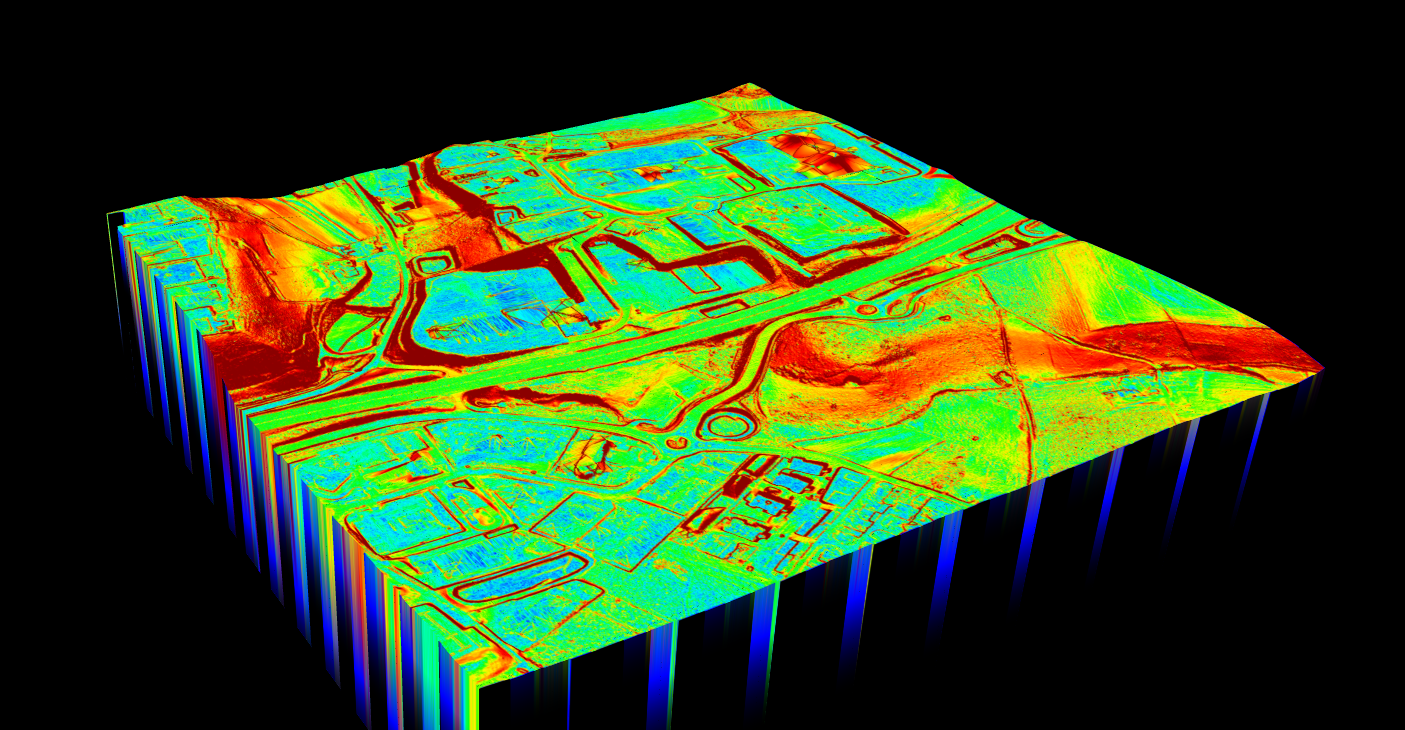
Slope map showing river valley drainage patterns for flood modeling
Insurance Use Cases
Underwriting Accuracy
Verify flood zone classifications, identify properties that are over- or under-priced relative to actual risk, and make more accurate pricing decisions without expensive field surveys.
Claims Adjustment
After flood events, terrain data helps adjusters understand how water reached specific properties, verify claimed flood depths, and detect inconsistencies between claimed damages and terrain analysis.
Catastrophe Modeling
High-resolution DTMs improve flood model accuracy, especially for localized flooding events that coarse-resolution data misses. Better terrain data produces better loss estimates.
Portfolio Exposure
Systematic flood exposure analysis across thousands of properties: batch elevation extraction, concentration risk identification, climate scenario modeling, and reinsurance treaty optimization.
Getting Started
Public LiDAR data covers most of the United States through USGS 3DEP and state programs. Lidarvisor processes raw point clouds into insurance-ready deliverables in minutes.
01
Identify
Identify areas of interest: portfolio concentrations, high-value properties, disputed flood zones.
02
Download
Download available LiDAR point clouds from USGS or state repositories.
03
Process
Process point clouds through Lidarvisor to generate DTMs and slope maps.
04
Integrate
Integrate elevation data into underwriting workflows and cat models.
Make Flood Risk Assessment Practical
Lidarvisor processes raw point clouds into insurance-ready deliverables in minutes, making LiDAR-based flood risk assessment practical for routine underwriting decisions, not just special investigations.
Create a FREE account now and start processing your point cloud
Get 2 GB of storage space and classify up to 10 hectares for free.