Measure canopy height, detect individual trees, and generate forest inventory deliverables from LiDAR point clouds
Why LiDAR Matters for Forest Inventory
Traditional field plots provide detailed measurements, but they only sample a small portion of the landscape. LiDAR adds wall-to-wall 3D structure, which helps forestry teams estimate canopy height, map crown extent, understand terrain under dense vegetation, and detect individual trees across larger areas.
That does not replace field data. It complements it. LiDAR makes inventory planning and analysis more scalable by providing spatial context between plots and by supporting repeatable measurements across the whole forest block.
Core Forest Inventory Outputs
Forest inventory projects often combine several LiDAR-derived outputs rather than relying on a single product. These are the ones that usually matter most.
01
DTM
Bare-earth terrain for slope, access, drainage, and ground reference.
02
CHM
Canopy height model built from surface and terrain elevation differences.
03
Tree Tops
Local maxima or detected apex points used to estimate tree counts and spacing.
04
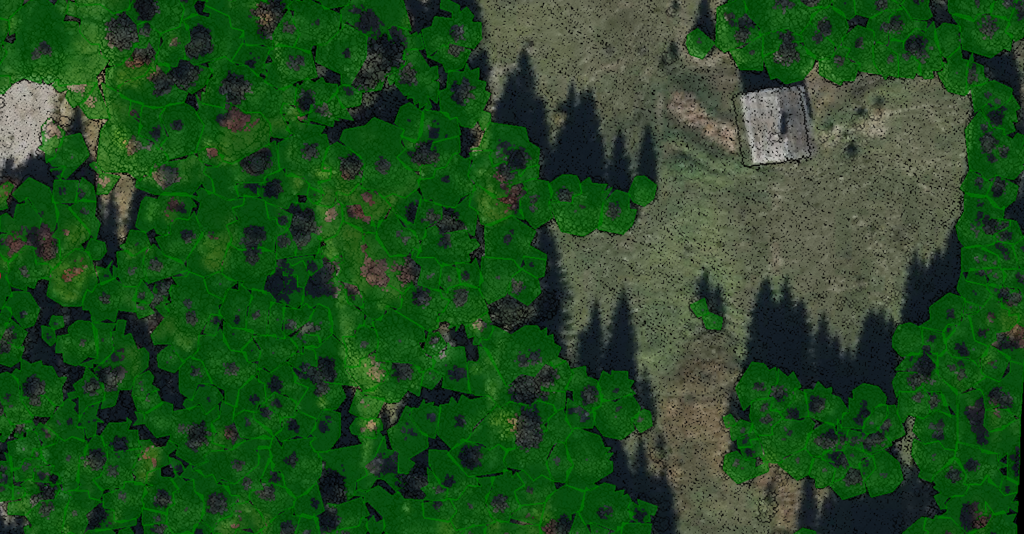
Tree Crowns
Polygon or segmented crown outputs that support stand structure analysis.
CANOPY ANALYSIS
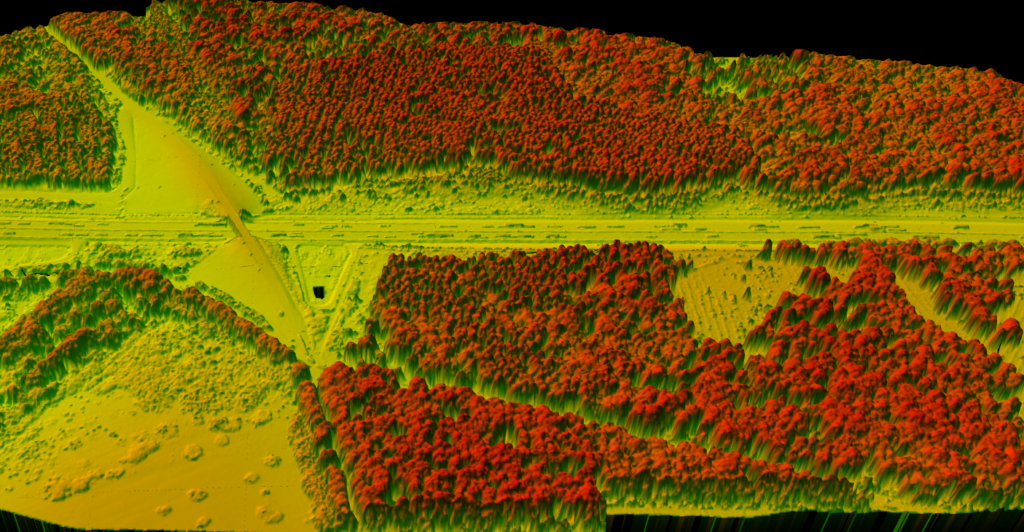
Canopy Height Models Support More Than Pretty Maps
A CHM turns raw 3D points into a practical forestry surface that is easier to interpret and compare
Canopy height models help identify stand variability, dominant tree zones, edges, and unusual structure patterns. In inventory workflows, they often become the bridge between raw point cloud data and tree-level or stand-level measurements that foresters can actually use.
✦Highlight height variation across the stand
✦Support tree-top detection and crown segmentation
✦Provide clearer visuals for forestry interpretation and reporting
TREE DETECTION
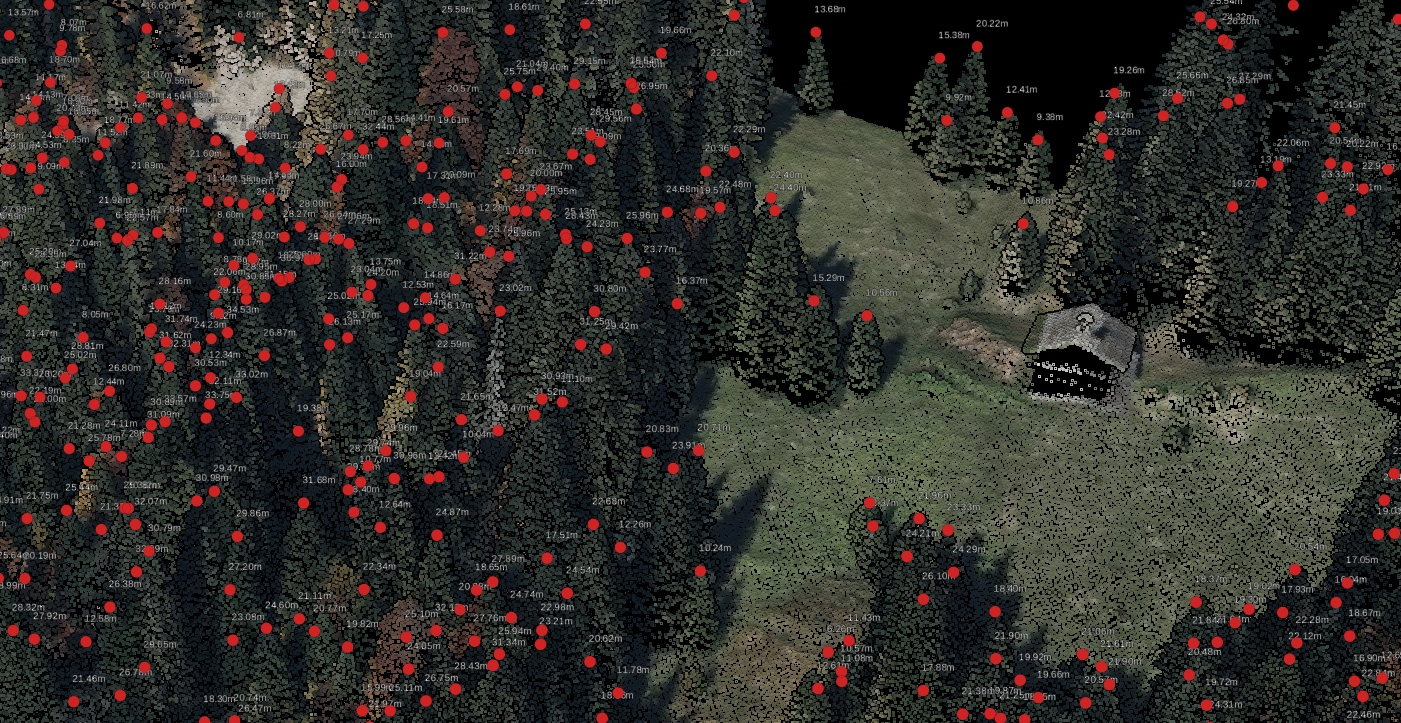
Individual Tree Detection Adds Inventory Detail
Tree tops and crown polygons help move from stand surfaces to tree-level insight
Tree detection can support stocking estimates, crown competition review, habitat studies, or pre-harvest planning. Results depend on forest type, canopy closure, point density, and segmentation settings, which is why tree-level outputs should be interpreted as part of a broader inventory workflow rather than a single perfect answer.
✦Estimate tree locations and spacing across the stand
✦Visualize crown extent and canopy separation
✦Export vector tree products for GIS analysis
Field Plots vs LiDAR: Better Together
Field-Only Approach
Field plots capture valuable detail, but they only sample part of the forest. Extrapolating from sparse measurements can miss structure changes between plots or across difficult terrain.
LiDAR + Field Data
LiDAR adds full spatial coverage between plots, giving forestry teams better context for height, terrain, stand variability, and tree-level patterns while field measurements continue to anchor interpretation and calibration.
Frequently Asked Questions
LiDAR is used to map terrain, estimate canopy height, detect tree tops, delineate crowns, and provide spatial structure across forest stands. It complements plot measurements by extending analysis beyond sampled locations.
Yes, LiDAR can support tree-top detection and crown segmentation, though results depend on forest type, canopy closure, point density, and the specific segmentation workflow used.
A canopy height model, or CHM, represents vegetation height above ground. It is usually created by subtracting a terrain model from a surface model and is widely used in forestry analysis.
No. LiDAR adds wall-to-wall spatial context, but field plots still provide species, diameter, and calibration data that remote sensing alone does not fully replace.
Useful outputs include classified point clouds, DTMs, DSMs, canopy height models, tree-top extraction, crown polygons, and vector products that can be used in GIS workflows.