Turn Forest LiDAR Data Into Actionable Insights in Minutes
The Challenge: LiDAR Processing Bottlenecks in Forestry
Forestry professionals face unique challenges when processing airborne LiDAR data. Dense canopy cover creates complex multi-return point clouds that are difficult to classify accurately. Traditional software requires extensive parameter tuning for each forest type, and extracting meaningful metrics demands specialized expertise.
Traditional Tools
Expensive desktop software with steep learning curves. Weeks of training before processing your first dataset. Manual parameter tuning for each forest type. Project timelines slipping while staff learn complex workflows.
Lidarvisor AI
Upload and process in minutes. No software installation or parameter tuning. AI automatically handles complex canopy structures. Get DTMs, tree crowns, carbon estimates, and vegetation metrics—fast.
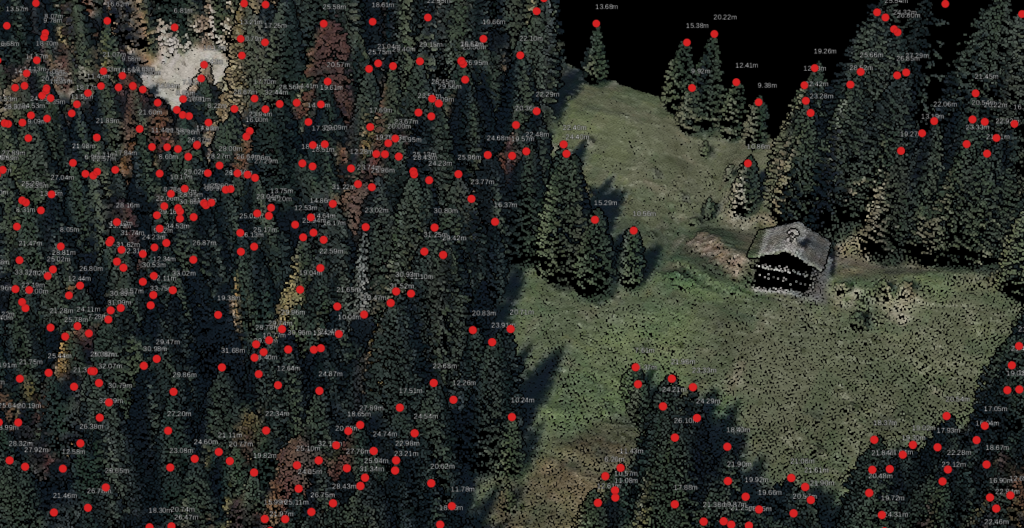
TREE DETECTION
Tree Crown & Tree Top Extraction
Individual tree data for forest inventory
Automatically detect and delineate individual tree crowns from your point cloud. Lidarvisor identifies tree tops and crown boundaries, giving you individual tree positions and crown polygons ready for forest inventory analysis.
✦ Individual tree top point locations
✦ Crown boundary polygons for each tree
✦ No manual digitizing required
NEW FEATURE
Carbon Estimation
Per-tree carbon stock from LiDAR-measured heights
Turn tree height data into carbon metrics that matter. Lidarvisor calculates per-tree carbon stock, CO₂ equivalent, and above-ground biomass using 102 species-specific allometric models across 8 geographic regions. Get the data you need for carbon credit programs, climate reporting, and forest carbon accounting.
✦ Carbon (t C), CO₂ equivalent (t CO₂eq), biomass (t AGB)
✦ 8 regions: Europe, Canada, USA, Tropical, Australia, Boreal, East Asian, African Dryland
✦ 102 species-specific allometric models
✦ IPCC-sourced methodology in PDF reports
Processing Options
Carbon Estimation Toggle
Enable per-tree carbon calculations with one click
Region Selection
Choose from 8 geographic regions for accurate allometric models
Species Dropdown
Select from 102 species-specific models or use regional defaults
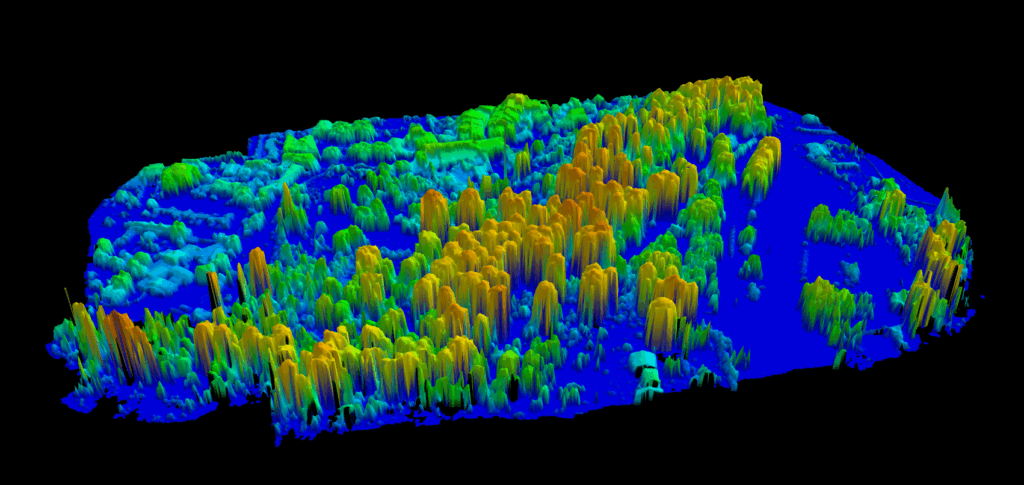
CANOPY HEIGHT MODEL
Canopy Height Analysis
Measure forest structure and vertical distribution
Generate Canopy Height Models (CHM) that show vegetation height above the terrain surface. Measure forest structure, identify dominant trees, and analyze vertical forest distribution—all automatically derived from your multi-return LiDAR data.
✦ CHM raster output ready for analysis
✦ Identify dominant and co-dominant trees
✦ Analyze vertical forest stratification
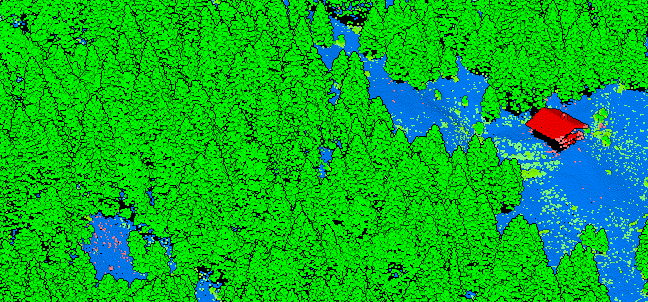
VEGETATION LAYERS
Vegetation Classification
Low, medium, and high vegetation separation
Lidarvisor classifies vegetation returns into meaningful layers: low vegetation (ground cover, shrubs), medium vegetation (understory), and high vegetation (canopy). This three-tier classification gives you the vegetation structure data needed for habitat assessment, fire fuel modeling, and forest management.
✦ Three-tier vegetation structure data
✦ Ideal for habitat and fuel modeling
✦ Automatic LAS class assignment
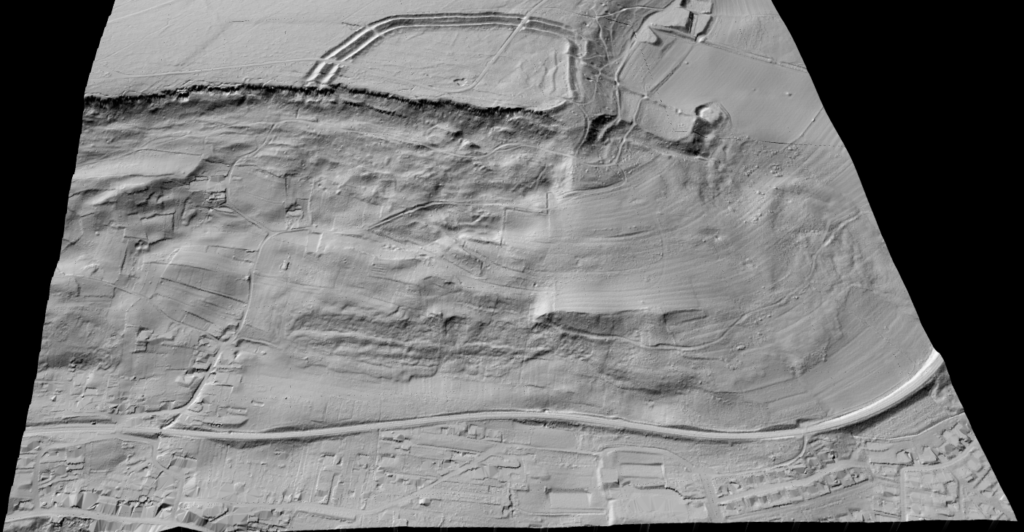
TERRAIN MODEL
DTM Generation Under Canopy
Accurate ground surface beneath dense forest
The most critical output for forestry: an accurate Digital Terrain Model that represents the true ground surface beneath dense forest cover. Lidarvisor filters through multiple vegetation returns to identify actual ground points, producing clean terrain models even in challenging forest environments.
✦ Penetrates dense canopy cover
✦ AI-powered ground classification
✦ GeoTIFF and contour exports
FOREST INVENTORY REPORTS
Digital Forest Inventory Report
Complete tree metrics in PDF and CSV formats
Lidarvisor generates comprehensive Digital Forest Inventory reports with individual tree metrics extracted from your LiDAR data. Download a professional PDF report for stakeholders or export raw CSV data for integration with forest management software and GIS workflows.
✦ PDF report with tree statistics and visualizations
✦ CSV export: height, crown diameter, crown area, X/Y coordinates
✦ NEW: Carbon columns in CSV (t C, t CO₂eq, t AGB per tree)
✦ NEW: Carbon Estimation Summary page in PDF reports
✦ Ready for forest management software integration
Your Forestry LiDAR Workflow
From raw point cloud to forestry deliverables in three simple steps
Forestry Use Cases
📊
Forest Inventory
Extract individual tree locations and crown dimensions for stand-level inventory and timber volume estimation.
🦅
Habitat Assessment
Analyze vertical vegetation structure to assess wildlife habitat quality and forest ecosystem health.
🪵
Timber Harvest Planning
Generate accurate terrain models for logging road design and harvest unit delineation.
🌍
Enhanced
Carbon Stock & Credits
Calculate per-tree carbon stock, CO₂ equivalent, and biomass for carbon credit programs and climate reporting using IPCC-sourced allometric models.
🔥
Fire Fuel Mapping
Classify vegetation layers to model fuel loads and assess wildfire risk across forested landscapes.
Frequently Asked Questions
Lidarvisor uses AI models trained on diverse forest types including conifer, broadleaf, and mixed stands. Detection accuracy depends on point density and canopy structure, but our algorithms handle complex multi-layer forests reliably. For best results, we recommend point clouds with 10+ points per square meter.
Lidarvisor calculates carbon stock from LiDAR-measured tree heights using species-specific allometric models. Enable carbon estimation in processing options, select your geographic region (Europe, Canada, USA, Tropical, Australia, Boreal/Russian, East Asian, or African Dryland), and choose from 102 species-specific models. The system outputs carbon (t C), CO₂ equivalent (t CO₂eq), and above-ground biomass (t AGB) per tree. Results appear in enhanced CSV exports and a dedicated “Carbon Estimation Summary” page in PDF reports, complete with methodology documentation and IPCC sources.
Yes. Lidarvisor handles large point clouds efficiently. Upload your LAS/LAZ files and our cloud infrastructure scales automatically. There’s no limit on file size for paid plans, and processing times remain fast even for extensive forest areas.
For forest inventory, you receive: classified point cloud (LAS), Digital Terrain Model (DTM), Digital Surface Model (DSM), Canopy Height Model (CHM), tree top points (CSV/SHP), tree crown polygons (SHP/GeoJSON), and a comprehensive Digital Forest Inventory report (PDF/CSV) with individual tree metrics including height, crown diameter, crown area, position coordinates, and optional carbon metrics (t C, t CO₂eq, t AGB per tree).
Our AI is trained on diverse forest environments: temperate deciduous, tropical rainforest, boreal conifer, plantation forests, and mixed stands. The algorithm adapts automatically—no parameter tuning needed for different forest types. For carbon estimation, select the appropriate geographic region and species to use the most accurate allometric model.
Pricing is based on processed hectares. Start with 10 hectares free to test our forestry outputs. After that, choose from flexible plans based on your project size. Volume discounts are available for large forest management operations.